Validated Microplans and Exports
Once a health facility (HF) has validated its microplan, GTS can produce a printable microplan for the HF team and Excel tables for the programme. This page describes the content of these outputs and where to download them.
HF staff validate their microplan as described in Reviewing your Health Facility Microplan.
Focal points apply the microplans and download the complete package as described in Auto Microplanning (Administrators).
Where to download microplans
Who |
Where |
What |
|---|---|---|
HF staff |
Microplan of the HF, Export button (available after validation, after the deadline, or once the microplans are applied); also Export in the Microplan validated window |
PDF or XLSX of this HF only ( |
Anyone with the moderation link |
HF list (Microplan Editing page), Export CSV |
The list of HFs with their validation status and last update ( |
Anyone with the moderation link |
HF list, Export menu (shown once the microplans are applied) |
XLSX for all HFs ( |
Focal points |
Tracking Round administration, Microplan tab, after Generate final targeted areas |
Excel for all HFs, ZIP of PDFs per HF, and a summary PDF |
The PDF microplan
The PDF microplan is the document the HF team takes to the field. It is printed in landscape A4 format and has two kinds of pages. Every page starts with a header showing the GTS logo, the areas and the name of the HF, summary figures (Visitation, number of areas, target population, period of the activity), the print Date and the page number.
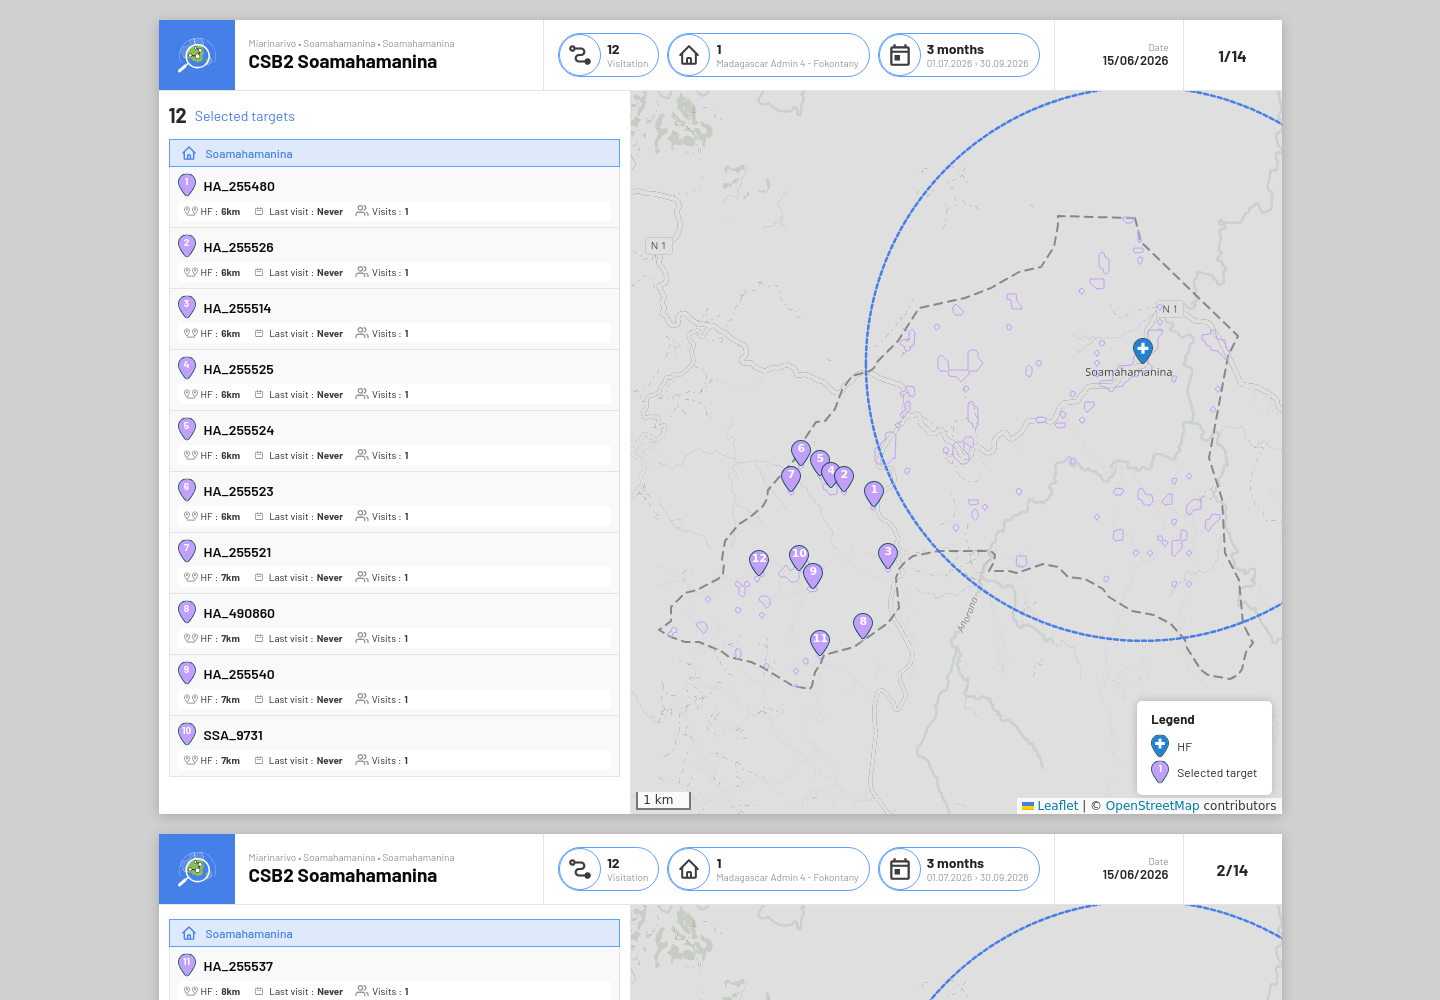
Overview page of the validated microplan of CSB2 Soamahamanina (MDG demo): 12 selected targets, page 1 of 14
Overview page
The first page (or pages, when the list is long) gives the full picture of the microplan:
on the left, the numbered list of Selected targets, grouped by area. For each locality: distance from the HF (HF :), target population, date of the last visit (Last visit :) and number of visits (Visits :);
on the right, a map of the HF area (grey dashed boundary) with the HF, the minimum-distance circle (blue dashed line) and the numbered selected localities.
When the list does not fit on one page, it continues on the next overview page. In the MDG demo, the 12 localities of CSB2 Soamahamanina fill two overview pages, followed by 12 locality pages (14 pages in total).
Locality pages
Each selected locality then has its own page, in the same order and with the same number as on the overview page:
name and number of the locality, distance from the HF, target population, last visit and number of visits;
Estimated time : — an estimate of the travel time from the HF, calculated from the distance at about 2 km per hour;
GPS : coordinates of the locality, to enter in a phone or GPS device;
a detailed map zoomed on the locality;
a wider map from the HF to the locality, with a red rectangle showing the area of the detailed map.
The route from the HF is drawn as a solid blue line when GTS has computed a road route, or as a dashed straight line otherwise.
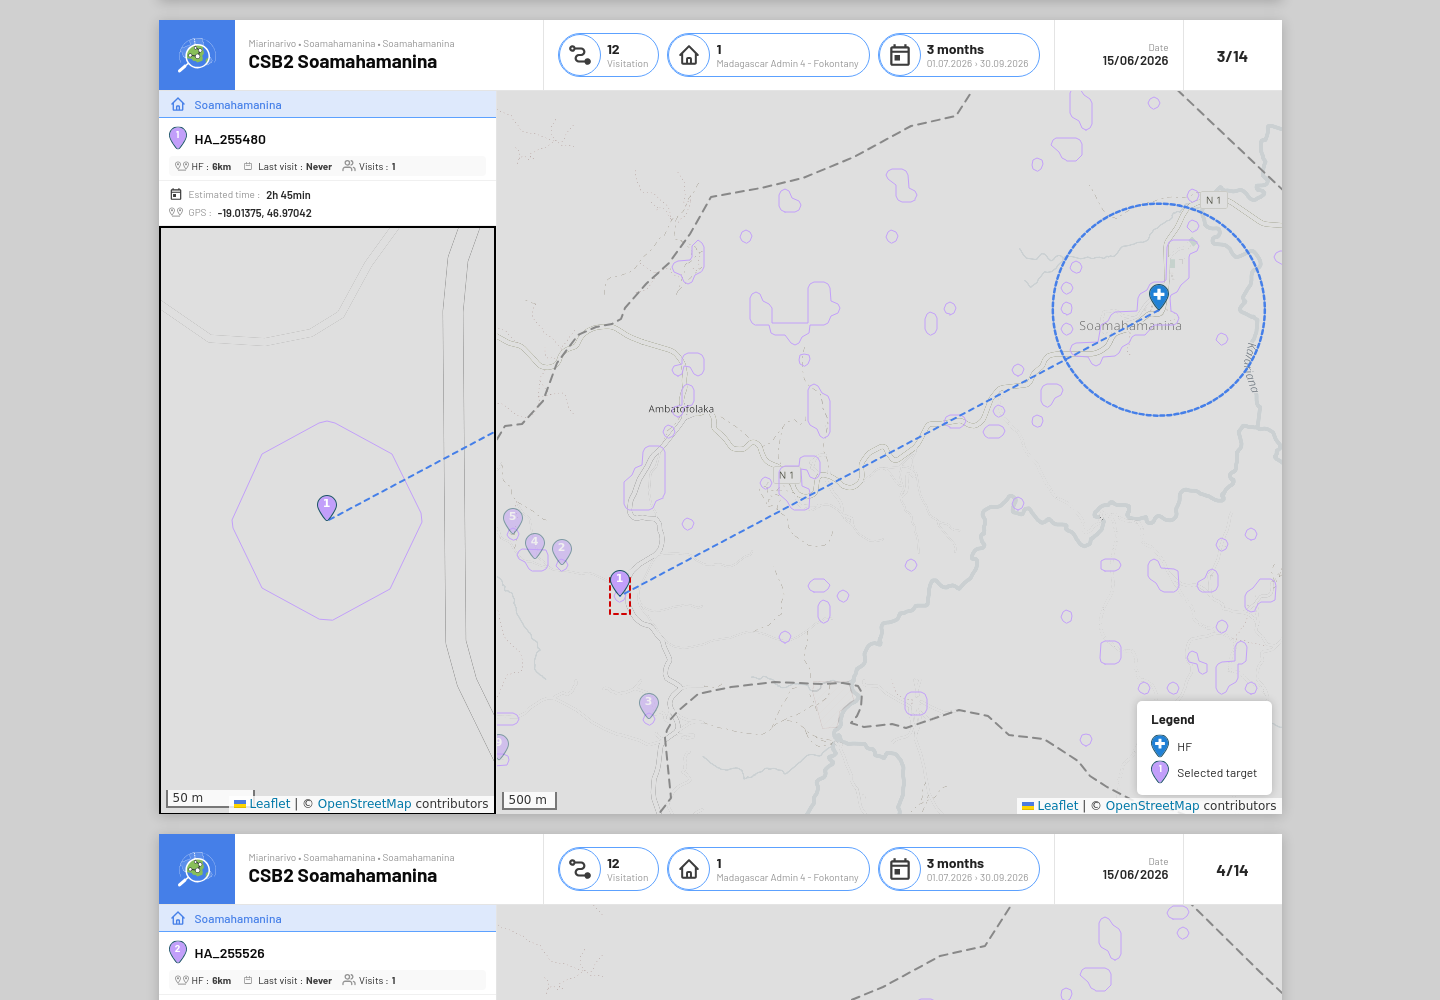
Locality page of the CSB2 Soamahamanina microplan: estimated time, GPS coordinates, detailed map and wider map from the HF
Language and basemap
PDF microplans are produced in the Report language chosen by the focal point in the Microplan tab (English or Français), whatever the language of the person who downloads them.
Maps use the PDF Basemap chosen by the focal point: OpenStreetMap Light or Satellite (ESRI). Satellite imagery can help field teams recognise villages and roads. In rural areas it may not exist at the closest zoom levels: the zoomed maps of the localities then show Map data not yet available; choose OpenStreetMap Light in that case.
To change the language or basemap of the files produced when applying microplans, the focal point changes the setting and applies the microplans again (see Auto Microplanning (Administrators)).
Viewing the microplan on screen
The PDF is a print of a read-only web page. If the moderation link is https://<server>/moderation/<token>,
the read-only microplan of one HF is available at
https://<server>/moderation/validated/<token>?hf_id=<HF id>&boundary_id=<area id>. The HF and area
identifiers are the ones shown in the browser address bar when the HF microplan is open. Add &lang=fr or
&lang=en to choose the language; otherwise the browser language is used.
Excel microplan
The Excel file contains one row per selected locality, with these columns:
for each administrative level above the locality (for example District, Commune, Fokontany): <level> Name and <level> ID;
HF Name, HF Lat, HF Lon;
Target Name, Target Lat, Target Lon;
Validation Done (1 when the HF microplan is validated);
Sort Indicator Value (the target population, when configured);
Number of Visits;
HF on map and Target on map — links that open the GTS map of the Tracking Round zoomed on the HF or on the locality (a GTS account is needed).
The file produced when the microplans are applied always lists all HFs, validated or not; use the Validation Done column to filter them.
Use it to plan logistics (vaccines, transport, per diem) by number of visits, or to import the plan into another tool.
Files produced when microplans are applied
When the focal point applies the microplans, GTS produces:
tr<ID>_microplan.xlsx— the Excel microplan for all HFs;tr<ID>_microplan_pdf.zip— one PDF microplan per HF;microplan_<Tracking Round name>_summary.pdf— the overview page(s) of every HF in one document, useful for district review meetings.
If Exclude non validated microplan is enabled, only validated microplans are included in the PDF files and in the final targeted areas; the Excel file still lists all HFs.