Tracking Round Selection (Map Wizard)
The Tracking Round Selection page (also called the Map Wizard) is the starting point of the GTS dashboard. It lists the Tracking Rounds you can see, shows them on a timeline, and gives a quick progress check for each round before you open its map.
Use this page to:
find a campaign round quickly, even when your organization runs many activities;
compare rounds at a glance (coverage, team reporting, data received);
open the map of a round, or its configuration if you are a Focal Point.
The page is opened after login and from the user menu with TR Selection.
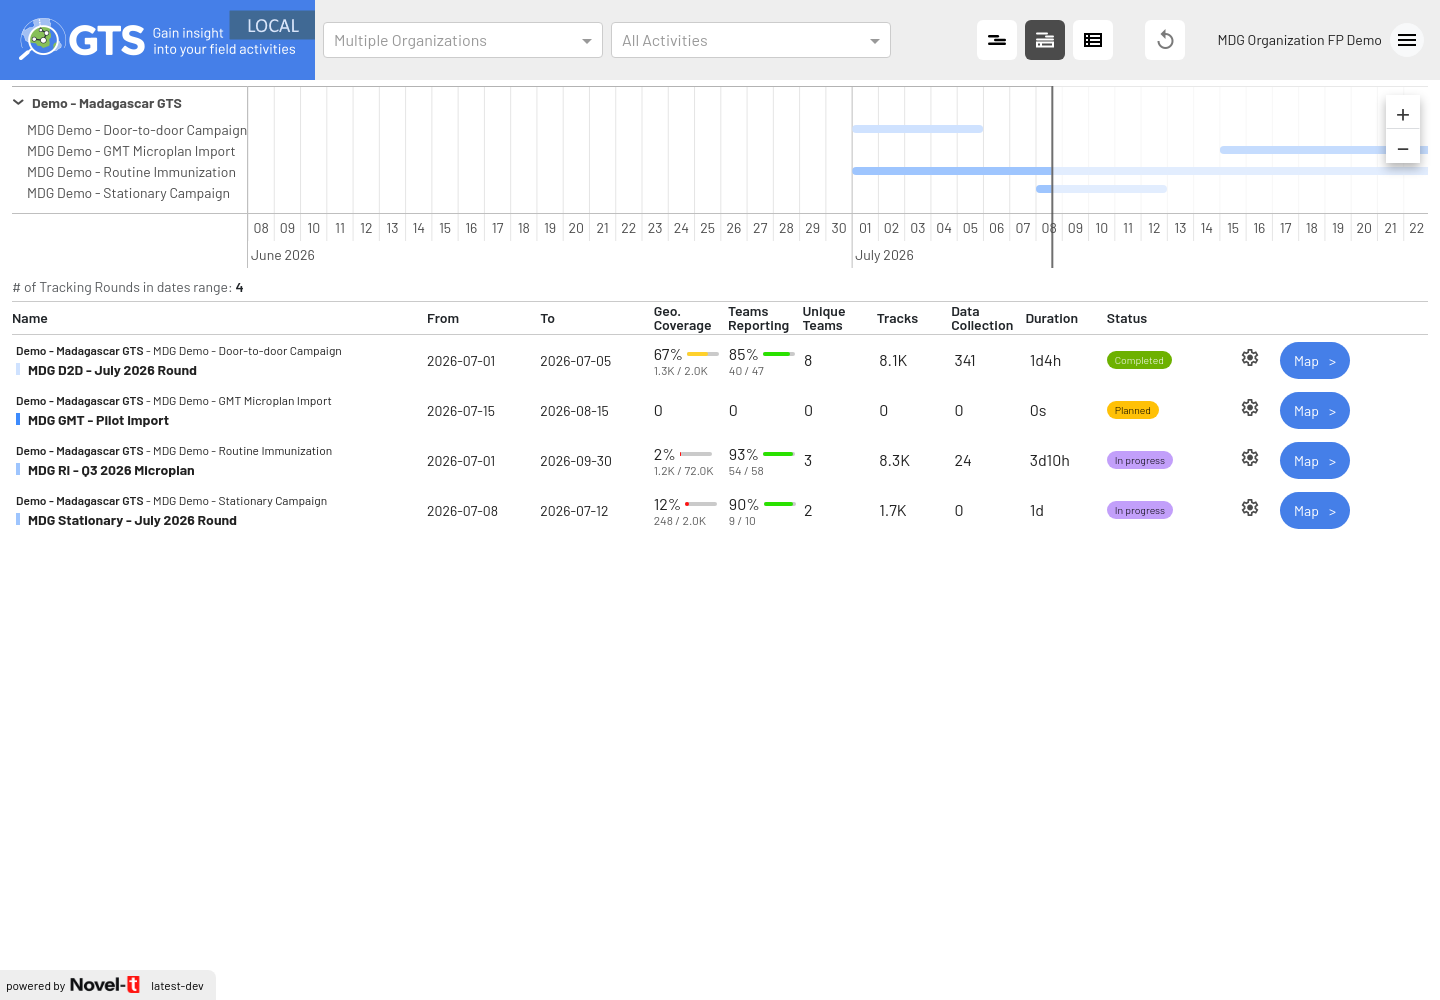
Tracking Round Selection for the Demo - Madagascar GTS organization
Page layout
The page has three parts, from top to bottom:
Filters and view buttons — organization and activity selectors, display mode and reset.
Timeline — one bar per Tracking Round, grouped by organization and Field Activity.
Table — one row per Tracking Round with its key indicators and the Map button.
Timeline
Each Field Activity has its own line, grouped under its organization (click the arrow next to the organization name to fold or unfold it). Each bar is a Tracking Round: it starts on the round start date and ends on the round end date. A vertical line marks today, and the area after today is shaded.
Move the timeline by dragging it left or right.
Zoom with the + and – buttons at the top right of the timeline.
Hover a bar to see a summary of the round: name, status, dates, organization and activity, Geographic coverage, Team reporting (number of team-days reported only, without the expected number), Unique teams and Duration.
Click a bar to highlight the matching row in the table.
Double-click a bar to open the map of the round.
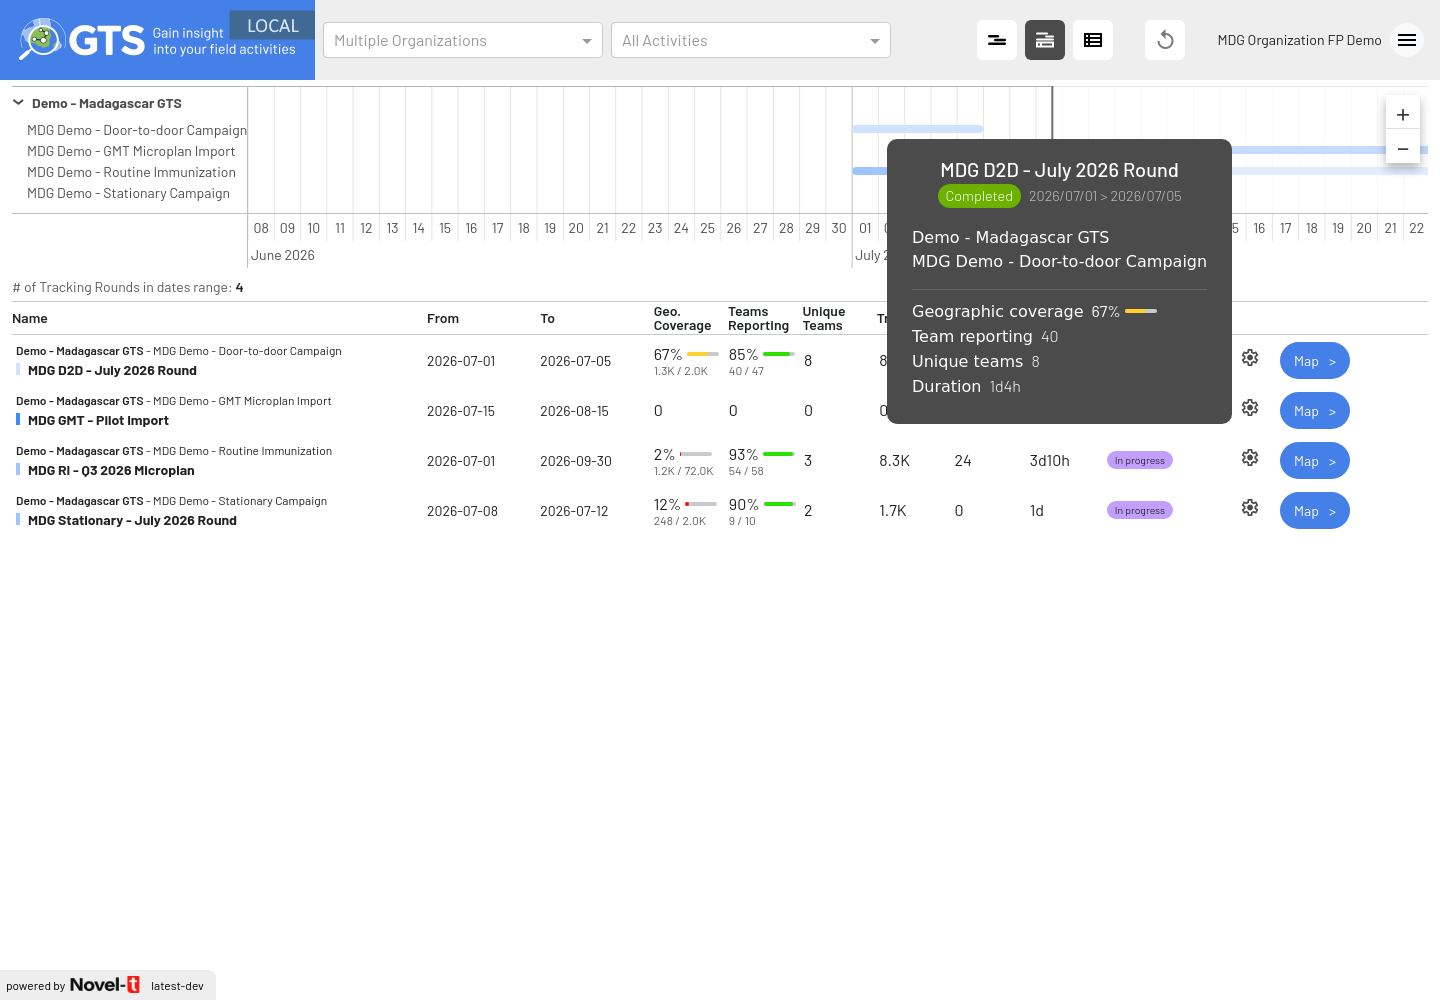
Summary shown when hovering the bar of the MDG D2D - July 2026 Round
The table only lists the rounds that overlap the period visible in the timeline. The number of rounds in that period is shown above the table (# of Tracking Rounds in dates range). If a round you expect is missing, move or zoom out the timeline.
Tracking Round table
In the Name column, each row shows the organization and Field Activity (small text) and the Tracking Round name. The other columns are:
Column |
What it tells you |
|---|---|
From / To |
Planned start and end dates of the round. |
Geo. Coverage |
Percentage of targeted areas visited, with the number of visited areas over the total below (for example 67% and 1.3K / 2.0K for the MDG D2D - July 2026 Round). See Geo-Coverage Investigation for what “visited” means. |
Teams Reporting |
Teams that reported, compared with the teams planned in the Teams Deployment of the round, with reporting / expected below. Each team is counted once per day it reported (team-days, see Map Indicators and Panels). For example, 85% and 40 / 47 for the MDG D2D - July 2026 Round: its 8 teams reported on each of the 5 days (40 team-days), while 8 to 11 teams a day were planned (47 team-days). If no Teams Deployment is configured, only the number of team-days reported is shown. |
Unique Teams |
Number of different teams that reported at least once during the round. |
Tracks |
Number of GPS track points received for the round, including points recorded while travelling or outside the targeted areas. |
Data Collection |
Number of form submissions (ODK) received for the round, including those sent outside the targeted areas. |
Duration |
Average time spent in the field per team over the whole round (total field time divided by the number of unique teams). The map shows a daily average instead (see Map Indicators and Panels), so the two values differ when teams work several days: for the MDG D2D - July 2026 Round, 1d4h (about 28 hours per team over the 5 days) here, and 5h38mn per team and per day on the map. |
Status |
Planned (start date in the future), In progress (today is between the start and end dates), Completed (end date passed) or Archived (only the final indicators were kept). |
Gear icon |
Opens the Tracking Round configuration (Access to tracking round configuration). Only shown to users who have access to the administration (Focal Points). |
Map > |
Opens the map of the round (see Map Overview). |
When a Tracking Round has targeted areas, Teams Reporting, Unique Teams and Duration only count activity inside the targeted areas. Rounds without targeted areas count all tracks.
The percentage bars are coloured to help you spot problems: green above 75%, yellow above 50%, orange above 25%, and red at 25% or below.
How to read the indicators
Geo. Coverage answers “how much of the planned area has been covered?”. A low value during a round usually means some areas have not been reached yet; at the end of a round it shows areas to plan for a catch-up.
Teams Reporting answers “are the teams we deployed actually working and sending data?”. A supervisor should follow up when this value drops: phones may be off, not tracking, or teams may not be in the field.
Tracks and Data Collection confirm that data is arriving. Zero tracks on an In progress round is a warning sign.
Note
Indicators are computed regularly in the background, not instantly, and this page refreshes its values at most every 10 minutes: they can be a little older than those of the map. The map shows the exact time of the last computation (see Map Overview).
Find and open a Tracking Round
In the organization selector, choose your organization, for example Demo - Madagascar GTS.
In the activity selector, choose the Field Activity, for example MDG Demo - Routine Immunization, or leave All Activities.
Find the round in the timeline or in the table. Move or zoom the timeline if it is not listed.
Check its status and indicators in the table, or hover its bar in the timeline.
Click Map > on the row (or double-click the bar) to open the map.
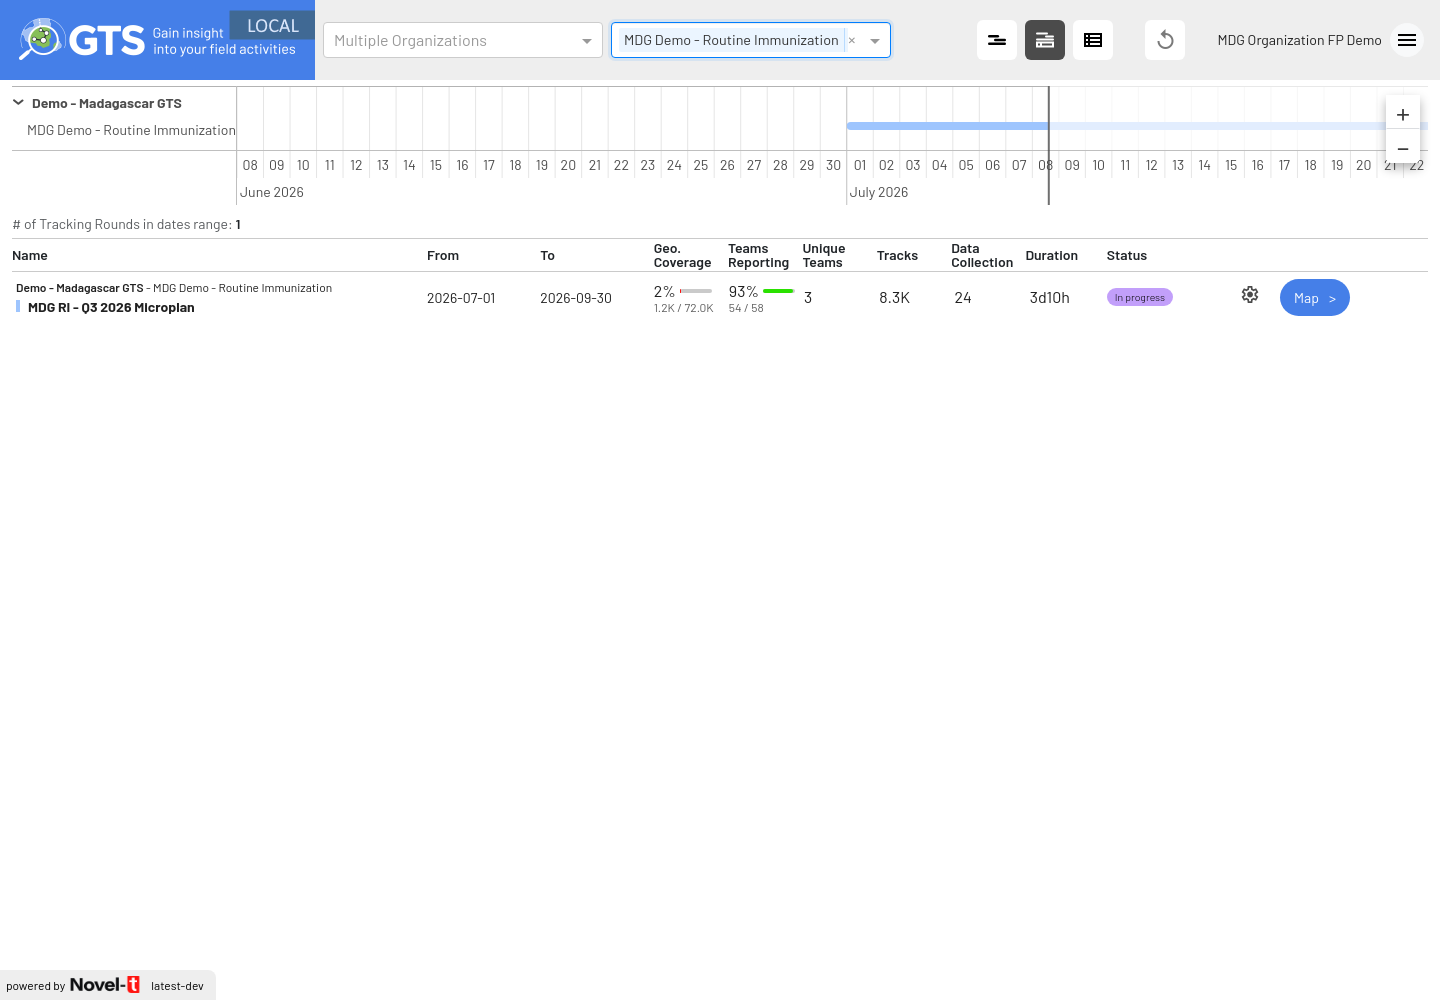
Table filtered to the MDG Demo - Routine Immunization activity
Focal Points can click the gear icon on the row to open the Tracking Round configuration instead.
Troubleshooting
- No activity found for your organization.
No Field Activity or Tracking Round is visible for your account. Focal Points can create them from the Admin link shown below the message; other users should contact their Focal Point.
- A round is missing from the table.
The table only shows rounds within the visible timeline period. Zoom out or move the timeline, and check the organization and activity selectors (use the reset button to clear them).
- The gear icon is not shown.
Your account has no access to the administration. Ask an Organization or Field Activity Focal Point.
- Indicators show a loading icon for a long time.
The indicators are being loaded or computed. Refresh the page after a few minutes.