Geocoverage indicators and Targeted Areas
The Geocoverage Indicators export gives, for every area of the Tracking Round (TR), the figures shown in the map: Targeted Areas visited, teams reporting, distance, duration and custom indicators such as population. It is the basis of most campaign reports, for example the list of localities not yet visited to plan a mop-up day (see Get the missed settlement list).
This export is only available when the TR has Targeted Areas.
Download the indicators
Open the map of the TR and click the download icon to open the Download options window (see Downloads and GPS tracks).
Choose the period. With Cumulated until, the figures are those of the whole round until the selected date. With Selected day only, they are the figures of that day.
Tick Geocoverage Indicators and choose the format:
Excel (default) — one workbook, for tables and pivot tables;
Shapefile — one zipped shapefile per layer, for GIS tools such as QGIS or ArcGIS;
Kml — one KML file per layer, for Google Earth.
With Excel, choose whether to include the Targeted Areas themselves with Export Targeted Areas (see below).
Check the e-mail address and click Download.
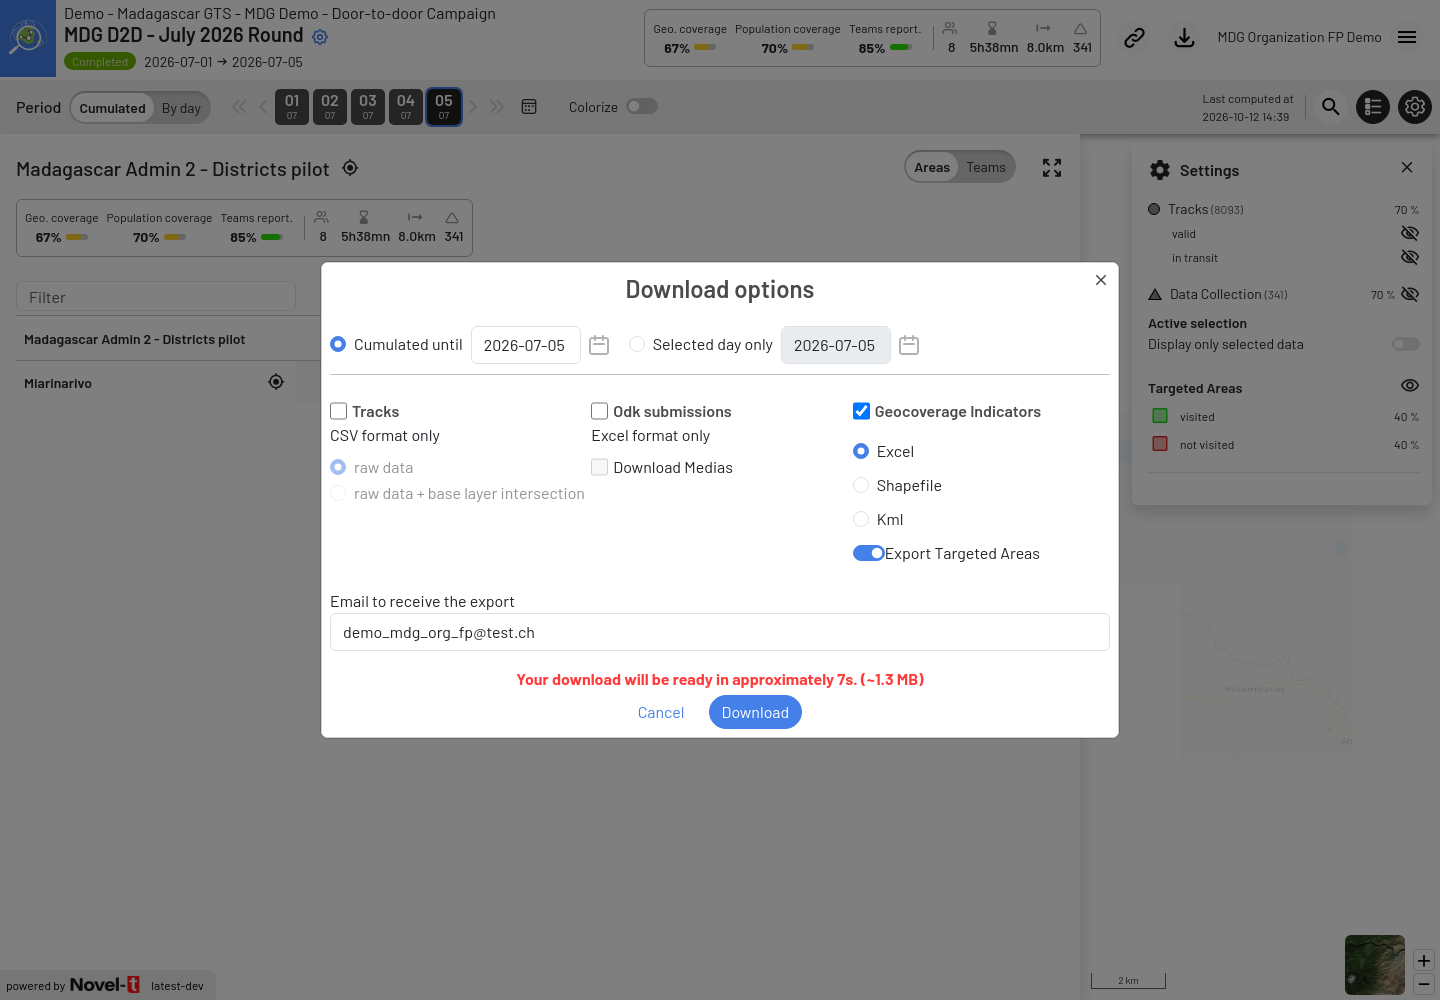
Download options window with Geocoverage Indicators in Excel and Export Targeted Areas turned on
The export always covers the whole TR, whatever the area selected in the map.
Note
The size and time estimate shown in the window depends on the number of areas and on the options selected. It is only an indication: the actual time depends on the load of the server.
Export Targeted Areas
The export contains one sheet or file per base layer (for example Districts, Communes, Fokontany and Localities in the MDG demo). With Export Targeted Areas (on by default), it also contains the Targeted Area layer itself, the most detailed level.
Turn it on when you need the status of each Targeted Area, for example to list the settlements not visited.
Turn it off when the base layers are enough: Targeted Area layers can contain tens of thousands of features, which makes the file much larger and slower to produce.
The switch is on by default. It is only visible when Excel is selected, but Shapefile and Kml exports use the same setting: they also include the Targeted Area layer unless you turned the switch off before changing the format.
The switch is not available (and the Targeted Areas are not exported):
when the Targeted Area layer is a grid (gridded population layers are too large to export);
for archived Tracking Rounds, because indicators by Targeted Area are no longer kept after archiving.
Content of the export
The files are in the Geocoverage_indicators folder of the ZIP file, named after the TR (without spaces or
punctuation), its ID and the export time, for example MDGD2DJuly2026Round_<TR ID>_<dd-mm-yy_HH-MM-SS>.xlsx.
Excel workbook
The workbook contains one sheet per layer, named after the layer, from the largest base layer to the smallest,
then the Targeted Areas (if exported). Each row is one area. Very large layers continue on a second sheet
(2_<layer name>) after about 1,000,000 rows.
Column |
Description |
|---|---|
<Parent layer> ID / <Parent layer> Name |
Identifier and name of the parent areas, one pair per larger layer. For example, a Commune row also gives its District. |
<Layer> ID / <Layer> Name |
Identifier and name of the area. |
Visited / Targeted Areas / Visited (%) |
Number of Targeted Areas visited, number of Targeted Areas, and percentage visited in the area. |
Service Coverage / Service Coverage Objective / Service Coverage (%) |
Replace the three previous columns when the Targeted Areas are service locations imported from a GMT microplan (see GMT microplan import): visits achieved, visits expected and percentage. |
Teams reporting / Teams deployed / Teams reporting (%) |
Teams that visited at least one Targeted Area of the area (with Cumulated until, each team is counted once; with Selected day only, the teams of that day), compared with the expected teams entered in Teams Deployment. |
Distance (meter) |
Total distance covered by the teams in the area, all tracks included. |
Duration (second) |
Total time spent by the teams in the area, all tracks included. |
<Indicator> num / <Indicator> den / <Indicator> num (%) |
One group of three columns per custom indicator of the TR, for example the estimated population in visited Targeted Areas, the total estimated population and the percentage. |
<Group> <value> … |
For grouped indicators, the same figures for each value of the group (except Teams reporting). Columns start with the attribute name (not the label shown on the map) and the value, for example |
Days |
Comma-separated list of the days on which the area had activity, up to the selected date. |
Percentages are rounded to one decimal; N/A means that the denominator is zero.
When stationary activity detection is used, the workbook also contains the sheets Detected Stationary Activities and Stat. Act. by Day by Team described in Stationary campaigns and fixed posts.
Tip
To list the localities not visited, open the sheet of the smallest base layer (or the Targeted Areas sheet), turn on the Excel filters and sort Visited (%) from smallest to largest. See Get the missed settlement list.
Shapefile and KML
With Shapefile or Kml, each layer is a separate file, <file name>_<layer>.zip (shapefile) or
<file name>_<layer>.kml, with the same columns as the Excel sheets. When stationary activity detection is
used, a file of the detected sites is added.
Shapefiles use the Web Mercator projection (EPSG:3857) and all attributes are stored as text. Column names may be shortened or simplified by the shapefile format.
KML files use WGS 84 coordinates; the attributes of each area are shown in its pop-up in Google Earth.
Compared with previous versions
The permission to download Targeted Areas is no longer configured when uploading the Targeted Areas. Every user who can open the map can export them, except for gridded layers.
The centroid coordinates (X, Y) are no longer exported in the Excel sheets. Use the Shapefile or KML export to get the geometry of the areas.
Sum indicators such as population are now exported as custom indicators (numerator, denominator and percentage).
Downloads are no longer started from the drill-down panel: they always use the Download options window and cover the whole TR.