Stationary campaigns and fixed posts
Many vaccination activities are not delivered house by house but at a site: a health facility (fixed post), a temporary post in a school or a market, an outreach session in a village, or a mobile team stopping for a few hours. Measles and HPV campaigns, and most Routine Immunization (RI) sessions, follow this model.
In these activities, the useful question for a supervisor is not “which houses were walked through?” but:
Were the planned sessions actually held, where and on which days?
How long did the team stay, and how often did it come back?
Which communities were within reach of a session?
GTS answers these questions with stationary activity detection: it finds, in the GPS tracks of the teams, the places where a team stayed long enough to be running a session, and shows them on the map as sites. No additional action is required from the field teams: they only need to carry a phone with GTS Tracker running, as in a door-to-door campaign.
This page is for programme managers, EPI focal points and supervisors. The examples come from the MDG Stationary - July 2026 Round (8 to 12 July 2026) of the MDG demo (MDG Demo - Stationary Campaign Field Activity), which uses stationary activity detection only. For a Tracking Round that combines door-to-door and stationary activity detection, see Routine Immunization monitoring.
How GTS detects a site
GTS looks at the tracks of each team, day by day:
A stay is a period during which the team remains within a small area (about 400 m across) for at least the Min. visit duration (60 minutes by default). Short stops, such as a break on the road, are ignored.
Stays at the same place are grouped into one site, even if they come from different teams or different days. A site therefore represents a location where sessions are held, with its history of visits.
Each site is classified using the activity types (detection rules) configured for the Tracking Round (TR), for example Fixed post and Temporary post in the MDG demo. A rule applies when, on enough different days (Min. number of day with visit), at least one team stayed there for the minimum visit duration. When several rules apply, the rule with the highest priority wins (see Activity types). In the default configuration, a place visited on 3 days or more is classified as a Health Facility, and a place visited on fewer days as Outreach.
A catchment area is drawn around each site, using the Catchment radius (R) of its rule. It represents the communities considered within reach of the session.
Note
Why a minimum duration? A vaccination session lasts at least one hour in most contexts. Requiring a minimum stay avoids counting a vehicle stopping at a junction or a team having lunch as a session. Adapt it to the shortest real session in your programme.
When the results are available
Stationary activity detection is not instantaneous. GTS runs it every night, starting at 21:00 UTC (midnight in Madagascar), on the tracks received since the previous run (since Release 3.9), and again in full when the stationary configuration of the TR is saved. Focal points cannot start a recomputation from the dashboard; contact GTS support if one is needed. In practice:
sites of a given day are visible on the map the next morning;
tracks uploaded late by a device that was offline are taken into account in the next night’s run;
results of archived Tracking Rounds are frozen and no longer recomputed.
Plan supervision meetings accordingly: the map of the morning shows the sessions up to the previous day.
Linking sites to Targeted Areas
When the TR has Targeted Areas (for example the 1,988 settlements of the MDG stationary campaign), GTS can use the sites to compute geographic coverage: a Targeted Area is counted as visited on the days when a site of a qualifying type was active and the centre of the Targeted Area lies within the site’s catchment area.
A Targeted Area within the catchment areas of several sites is counted as visited only once. On the map, where the catchment areas of two sites of the same type overlap, the overlap is split between them so that the map stays readable; this split is for display only and does not change the indicators.
Combining stationary and door-to-door work
Both strategies can be enabled in the same TR, for example when outreach teams also walk through the nearby hamlets. In that case, the time spent at a detected site is counted once as stationary activity, and only the door-to-door movement away from the site is added on top. Team durations are therefore not counted twice.
Configure stationary activity detection
Stationary activity detection is configured per Tracking Round, together with the Targeted Areas. Since Hotfix 3.7.6, users who have access to this configuration can add up to five rules (this was previously reserved to GTS administrators).
In the administration, open the Organization, the Field Activity and the Tracking Round.
Open the Targeted Areas tab and click Edit.
In step 2. Strategy & Configuration, click Select and configure on the Stationary activity detection card. The window Stationary activity and micro plan configuration opens.
Leave Do targeted areas contain stationary locations ? turned off. (Turn it on only when the Targeted Areas are themselves service locations, see Targeted Areas as service locations.)
Set the Min. visit duration (t) in minutes. It applies to all activity types.
Review the Activity types (up to five, Add to create one) and the 2. Geocoverage option, then click Validate.
Continue the wizard and click Save.
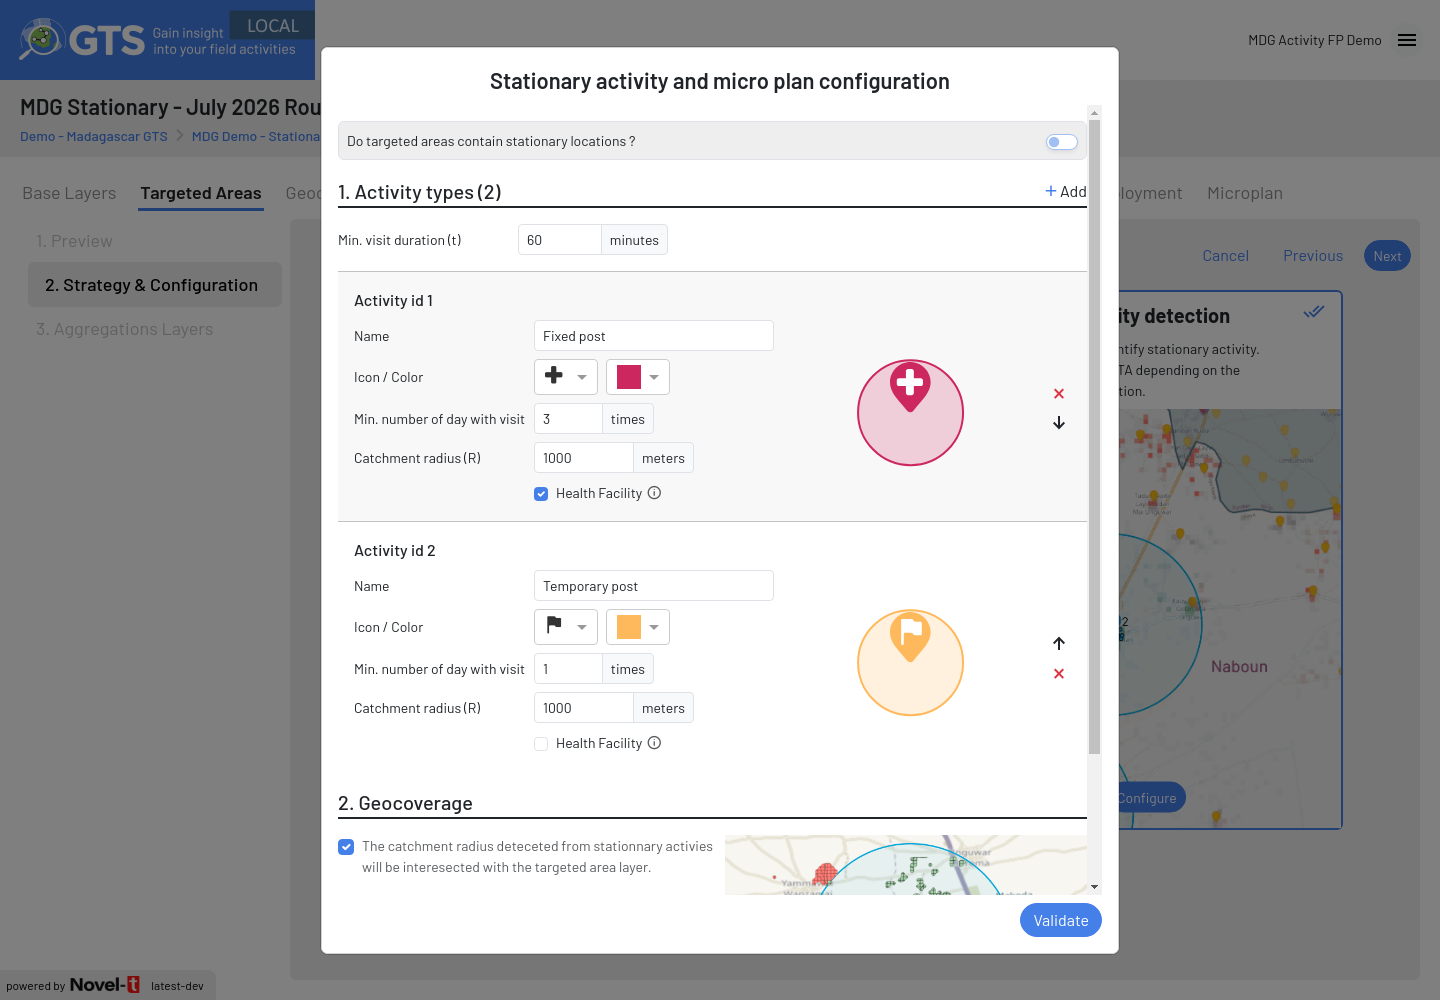
Stationary activity and micro plan configuration window of the MDG stationary campaign: one minimum visit duration (60 minutes), two activity types, Fixed post (3 days, 1000 m, Health Facility) and Temporary post (1 day, 1000 m), and Geocoverage enabled
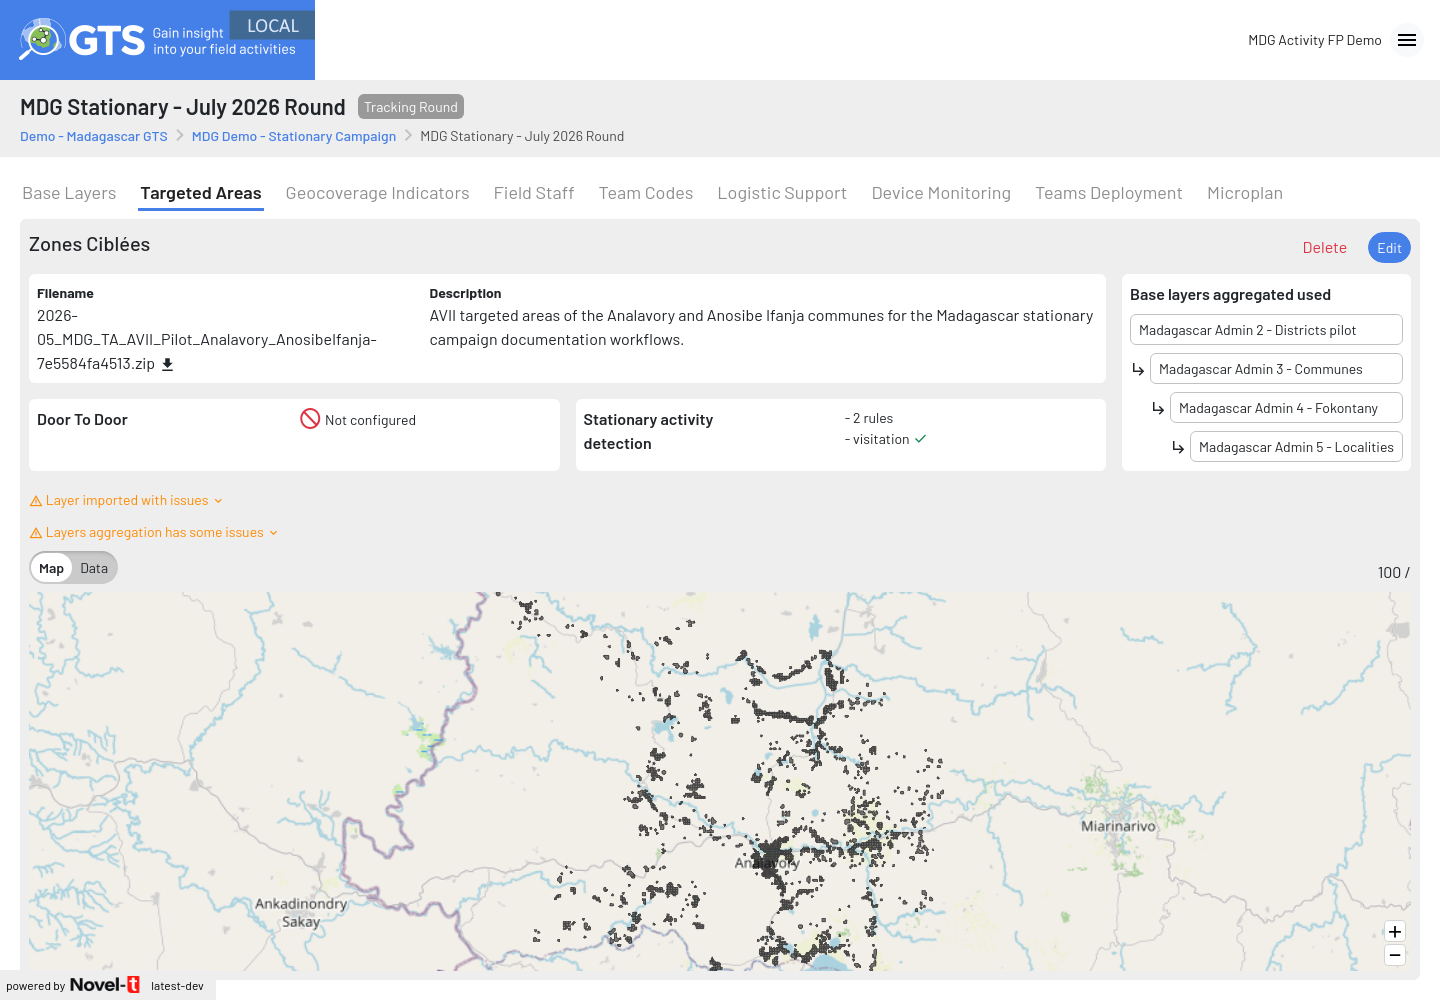
Targeted Areas tab of the MDG stationary campaign Tracking Round: door-to-door is not configured; stationary activity detection is (2 rules, visitation enabled)
The summary of the Targeted Areas tab shows the strategies in use: for stationary activity detection, the number of rules and whether visitation (Geocoverage) is enabled.
Activity types
Each activity type (rule) has the following settings:
- Name
Name shown on the map and in the exports, for example Health Facility, Outreach or Mobile team.
- Icon / Color
Symbol used for the sites of this type on the map.
- Min. number of day with visit
Number of different days (consecutive or not) on which the site must have been visited for this type to apply. Fixed posts are visited every working day; outreach sites only a few times per round.
- Catchment radius (R)
Radius in metres of the catchment area drawn around the site. The field expects at least 1,000 m.
- Health Facility
Marks the rule that represents health facilities (fixed posts). Only one rule can be marked. It does not change detection, but the stationary activity export then gives, for each other site, the distance to the closest health facility visited by the same team. This helps managers distinguish outreach work from fixed-post activity.
When a site meets the conditions of several rules, it takes the type of the rule with the highest priority. The default rules are already in the right order (Health Facility before Outreach), and a rule you add comes after the existing ones. The up and down arrows currently only change the order on screen, not the priority used by GTS: create the most demanding rules first.
By default, GTS proposes two rules:
Name |
Min. number of day with visit |
Catchment radius (R) |
Health Facility |
|---|---|---|---|
Health Facility |
3 |
2500 m |
Yes |
Outreach |
1 |
2500 m |
No |
Geocoverage
In section 2. Geocoverage, tick the option stating that the catchment radius detected from stationary activities will be intersected with the targeted area layer, to compute visited Targeted Areas from the sites (see Linking sites to Targeted Areas). Leave it unticked if you only want to see where and when sessions took place.
Warning
When Geocoverage is enabled, changing the rules (or enabling Geocoverage) restarts the stationary activity computation of the whole TR from the beginning, which can take time on long rounds. Avoid changing the configuration in the middle of a review.
Targeted Areas as service locations
When the Targeted Areas are themselves the planned service locations, Do targeted areas contain stationary locations ? is turned on. GTS then does not search for sites: it checks, day by day, whether a team stayed at each planned location, and compares the visits with the planned frequency of visit:
Columns mapping links the columns of the layer to the type of location, the location of service, the maximum distance of the tracks around it, the minimum duration and the Objective of visit;
the map shows a Service cov. indicator (visits achieved compared with the visits expected over the period) instead of Geo. coverage.
This mode is designed for microplans prepared in GMT: GTS turns it on and fills the columns mapping when the Targeted Areas are a GMT package. The settings, how Service cov. is computed and the current limitations are described in GMT microplan import. In this mode, door to door cannot be configured at the same time, and custom indicators are not available.
Monitor the activity on the map
Open the map of the TR from the Tracking Round Selection page (see Map Overview).
The header and the data panel summary show, next to the coverage indicators, the number of sites detected for each activity type, with its icon.
In the Settings panel, the Stationary Activity section lists the activity types; use it to show or hide the sites of each type.
In the left panel, the Activity tab lists the detected sites (see Activity tab below). Expand a site to see its History: each Visit date, the Team, the Duration and the Device ids.
Use the Period selector (Cumulated or By day) to review a single day or the round up to a date. With By day, the Activity tab only lists the sites visited that day.
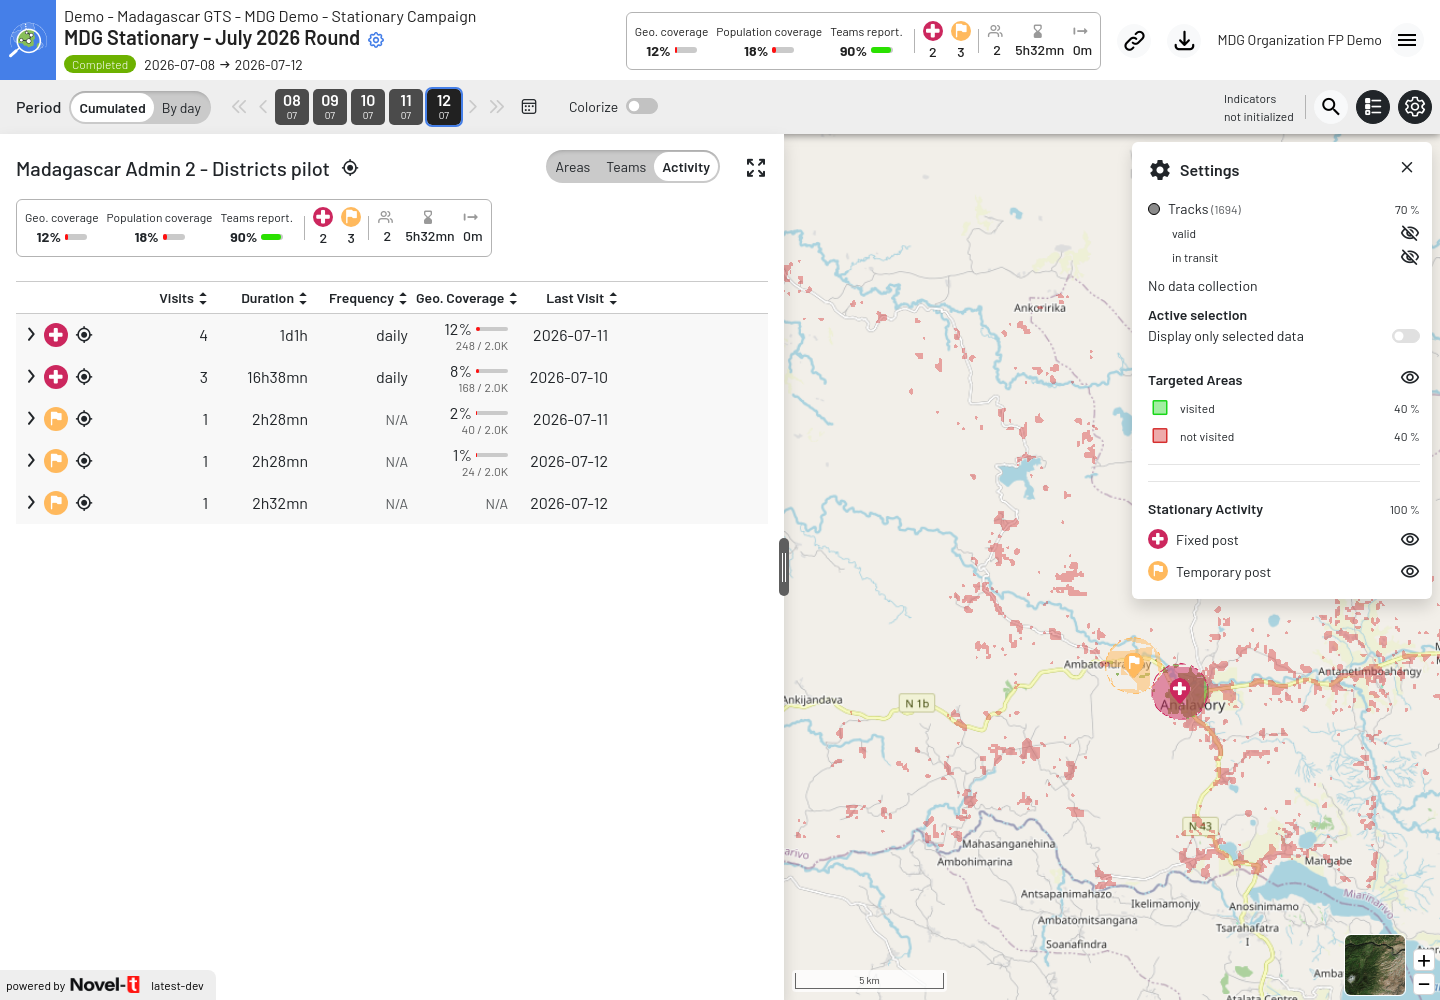
Map of the MDG stationary campaign at the end of the round: 2 Fixed post and 3 Temporary post sites in the header and in the Activity tab, the Stationary Activity section of the Settings panel, and a fixed post and a temporary post near Analavory with their catchment areas on the map. (The period bar shows Indicators not initialized instead of Last computed at: a known display issue of the computation status; the figures are computed.)
In the MDG stationary campaign, two teams worked for five days. GTS detected 5 sites: 2 Fixed post sites, visited on 4 and 3 days (the health facilities CSB2 Analavory and CSB2 Anosibe Ifanja), and 3 Temporary post sites, visited on one day each. A 40-minute stop of one team, shorter than the 60-minute minimum, was not detected. The catchment areas of the sites cover 248 of the 1,988 Targeted Areas: Geo. coverage is 12% (12.5%), and the covered areas hold 18% of the estimated population (Population coverage). A low coverage is expected here: a fixed post only reaches the communities around it.
The Teams Deployment of this round plans one team per commune and per day, 10 team-days in all. On the last day, the Anosibe Ifanja team held its temporary post outside the Targeted Areas of its commune, so it is not counted as reporting there: Teams report. shows 90% (9 / 10).
Activity tab
The Activity tab gives one row per detected site, with the icon of its activity type:
- Visits
Number of days on which the site was visited (up to the selected day with Cumulated).
- Duration
Total time spent at the site by the teams on its visit days.
- Frequency
Regularity of the visits, estimated from the number of days between two visits: daily, 2x per week, 3x per week, 4x per week, weekly, 2x per month, 3x per month or monthly. N/A means fewer than two visit days, or visits too irregular to match one of these values. Shown with Cumulated only.
- Geo. Coverage
Targeted Areas counted as visited from this site, compared with all the Targeted Areas of the round. Use the Areas tab for coverage figures: the values of the sites can overlap and add up to more than the total of the round.
- Last Visit
Date of the most recent visit.
Questions supervisors can answer
Was the outreach session in this village held this week? — Search the village on the map, check whether a site was detected nearby and open its history.
Are fixed posts open every day? — Filter by day and compare the Health Facility sites with the list of facilities expected to vaccinate.
Which communities were not reached by any session? — With Geocoverage enabled, the Targeted Areas not visited remain red on the map and are listed in the geocoverage export.
Keep in mind that GTS only sees what the phones record: a session held by a team whose phone was off, or a stay shorter than the minimum duration, is not detected. Use GTS together with tally sheets and supervision reports.
Export the stationary activity
When stationary activity detection is used, the Geocoverage Indicators Excel export (see Geocoverage indicators and Targeted Areas) contains two additional sheets:
- Detected Stationary Activities
One row per site: the areas of each base layer where it lies, detection type, location (longitude and latitude), visit days, teams, devices, duration, Targeted Areas visited and a link to the site in GTS.
- Stat. Act. by Day by Team
One row per site, day and team, with the devices used. When a rule is marked Health Facility, it also tells whether the site is a health facility and gives the closest health facility of the team, its coordinates and its straight-line distance.
With Shapefile or Kml, the detected sites are exported as an additional layer.
Note
The Download options window can also show a Stationary Activity option (Excel format, with the date
of its Last computation). It is a custom report prepared for some Madagascar rounds, set up on request by
the GTS team and updated once a day when new data has arrived: report_<TR ID>.zip, with the workbook
MDG_report.xlsx (sheets in French on outreach vaccination sites and ODK forms) and additional workbooks on
devices and ODK submissions. It uses its own detection settings, not the activity types of the TR. The MDG
demo rounds do not have it.