Map Overview
The map of a Tracking Round shows where teams have worked, which targeted areas have been visited, and the main indicators of the round. It opens from Tracking Round Selection (Map Wizard) with the Map > button.
This page explains the layout of the map and the controls you use every day. The data panel is described in Geo-Coverage Investigation (areas) and Map Indicators and Panels (indicators and teams).
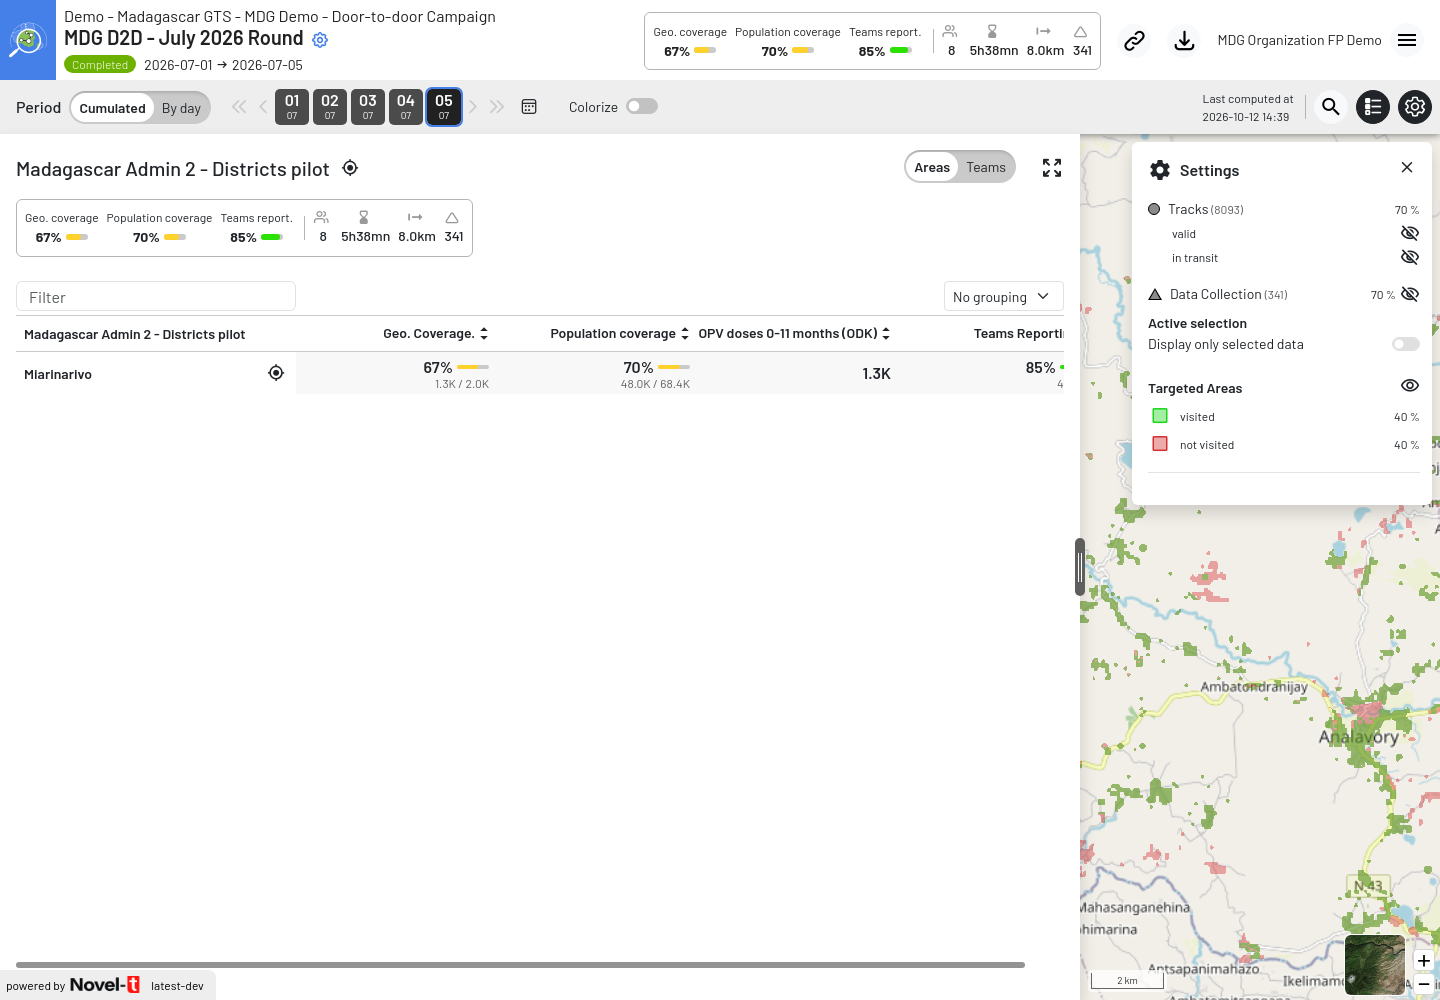
Map of the MDG D2D - July 2026 Round with the data panel (left) and the settings panel (right)
Map layout
The map page has four zones:
Header (top) — the Tracking Round, its global indicators, and the share, download and user menu buttons.
Period bar (below the header) — the period selector, the day chips, Colorize, the computation status, and the search, data panel and settings buttons.
Data panel (left) — indicators and lists by area or by team. It can be hidden.
Map (right) — targeted areas, tracks and data collection points, with the Settings panel, the basemap selector and the zoom buttons.
When the round has targeted areas, the map opens on the whole targeted area with the data panel showing the largest aggregation level (for example Madagascar Admin 2 - Districts pilot).
Header
From left to right:
- Organization - Field Activity
For example Demo - Madagascar GTS - MDG Demo - Door-to-door Campaign. Click the organization or the activity name to go back to Tracking Round Selection (Map Wizard), filtered on that organization or activity.
- Tracking Round name
For example MDG D2D - July 2026 Round. Click it to return to Tracking Round Selection (Map Wizard). The gear icon next to it opens the Tracking Round administration (Open Tracking Round Administration).
GTS administrators may also see a red warning icon: some targeted areas fall outside the selected base layers and are ignored. Click it to open the Targeted Areas configuration.
- Status and dates
The status badge (Planned, In progress, Completed or Archived) and the round dates, for example 2026-07-01 → 2026-07-05.
- Global indicators
A summary of the whole round: Geo. coverage, custom indicators configured by the Focal Point (for example Population coverage), Teams report., then small icons for unique teams, average daily time, average distance and data collection. These values do not change when you select another day in the period bar; the data panel does (see Choose the period). Hover a value to see how it is calculated. See Map Indicators and Panels for details.
- Link button
Copies the address of the current map to the clipboard (Url copied to the clipboard). See Share the map.
- Download button
Opens the Download options dialog to export tracks, form submissions, geocoverage indicators and targeted areas (see Downloads and GPS tracks).
- User menu (three lines)
TR Selection, Admin (Focal Points), Moderation (when microplans exist, see Reviewing your Health Facility Microplan), Help and Log out. People who are not signed in (for example with a public link) see a Sign In button instead.
Choose the period
The period bar controls which days are included in the data panel (indicators and lists) and in the map layers. The global indicators of the header always show the whole round.
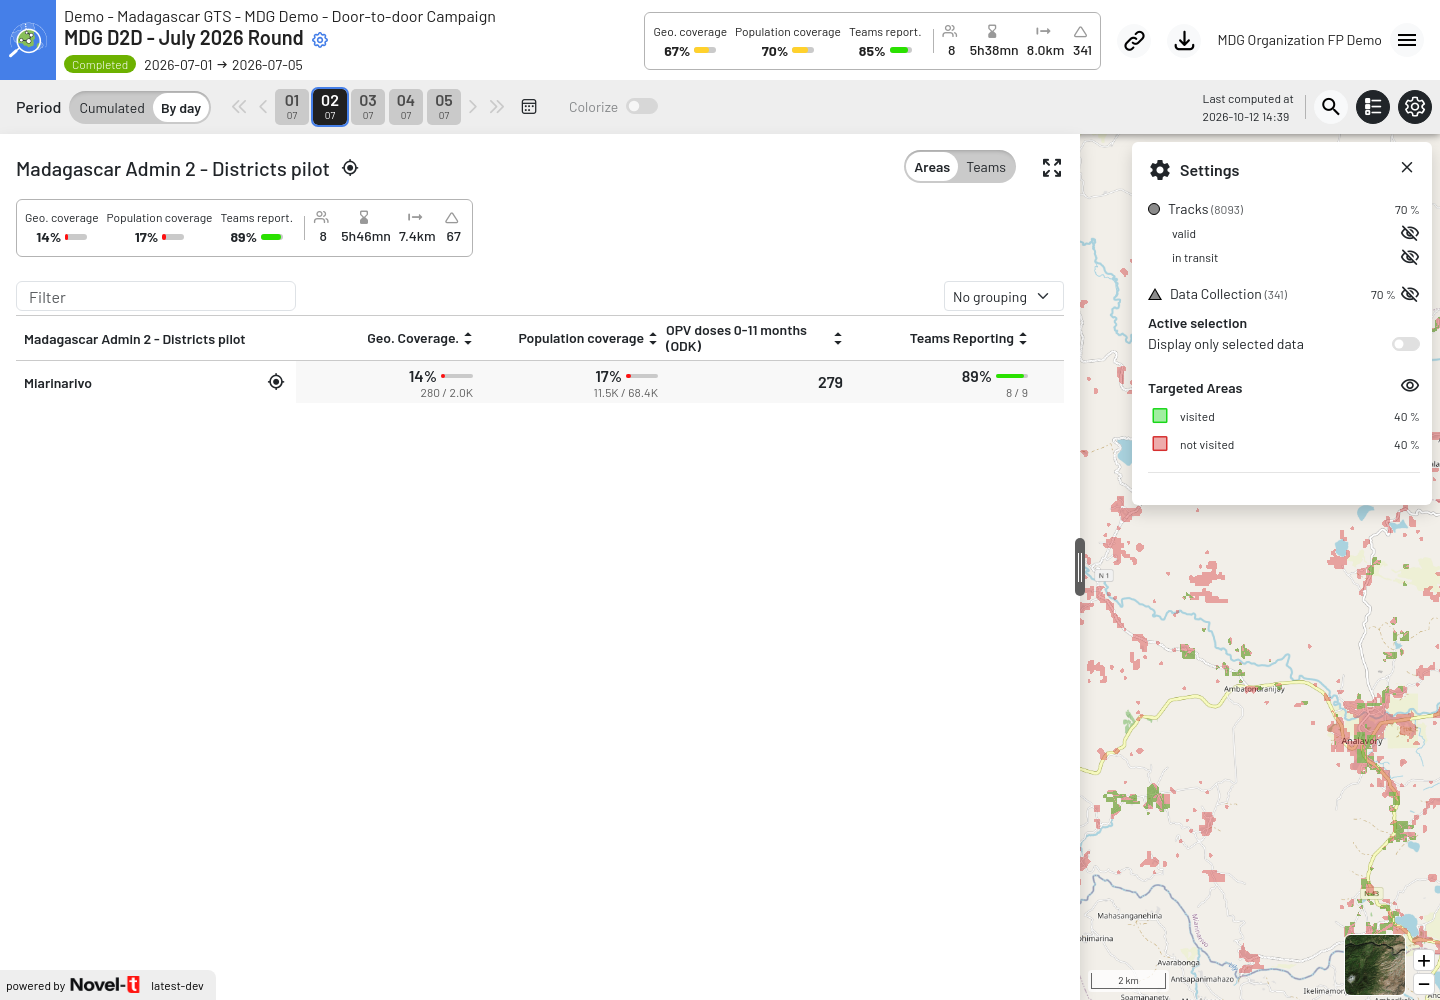
By day with 2 July selected: the data panel and the map show only that day (for example 8 of the 9 teams planned that day reported: 89%), while the header still shows the whole round
- Period
Cumulated (default) — everything from the first day of the round up to the selected day. Use it to follow progress: “how much has been covered so far?”.
By day — only the selected day. Use it to review one day of work: “where did teams go on 2 July?”.
- Day chips
One chip per day of the round (day and month). Click a chip to select that day. In Cumulated mode, all days up to the selected one are highlighted. When the map opens, the last day of the round is selected (or today, if the round is still in progress: the days after today are not shown).
- Arrows
The single arrows move the chips by one day; the double arrows move by a full page of days. They are grey when there are no more days in that direction.
- Calendar icon
Opens a calendar to jump directly to a day of the round.
- Colorize
Only available in Cumulated mode. Gives each of the last seven days (up to the selected day) its own colour, on the day chips and on the tracks and data collection points of the map. Older points keep a neutral colour. If no tracks are displayed, Colorize turns on the valid tracks. Use it to see the order in which teams covered an area.
To review a single day:
Click By day.
Click the day chip, or use the calendar icon.
Read the indicators in the data panel; the map now shows only that day.
Click Cumulated to return to the progress view.
Note
Days follow universal time (UTC). GTS changes day at midnight UTC, not at midnight in your country. The day chips, the By day view, the daily indicators and the visit dates of the targeted areas all use UTC days, whatever the time zone of your computer, of the field teams or of the Field Activity. In Madagascar (UTC+3), work recorded between midnight and 03:00 local time counts on the previous day; in a country west of Greenwich (UTC-5, for example), work recorded after 19:00 local time counts on the next day. The times shown in the track and form details are also in UTC (marked (UTC)); the time of the last computation (below) is shown in the time zone of your computer.
Computation status
At the right of the period bar, GTS shows when the indicators were last updated, for example Last computed at 2026-10-11 10:32.
A small spinning icon means new data is being processed; the values shown are not yet up to date. Hover it to see when the computation started.
When the new values are ready, GTS opens a New indicators computed window: click Reload to see them (the teams you selected and the Settings you changed are reset), or Cancel to keep working. An orange warning icon then stays in the period bar (Indicators have been recomputed. Reload the page to see the last values.); click it to open the window again.
Indicators not initialized means the round has not been computed yet.
For an archived round, Indicators archived at and the date of archiving are shown instead. Only final indicators were kept: the period selector, the day chips, Colorize, the Areas / Teams switch and some drilldown levels are disabled.
Map buttons
Three round buttons at the right of the period bar open the main tools:
- Search (magnifying glass)
Type at least three characters to search the round. Results are grouped in tabs: Targeted Areas, Base Layers, Additional Layers, Teams, ODK Submissions and OSM (place names from OpenStreetMap). Targeted area results show their aggregation path and their coverage indicators. Click the locate icon (Zoom to) of a result to move the map there.
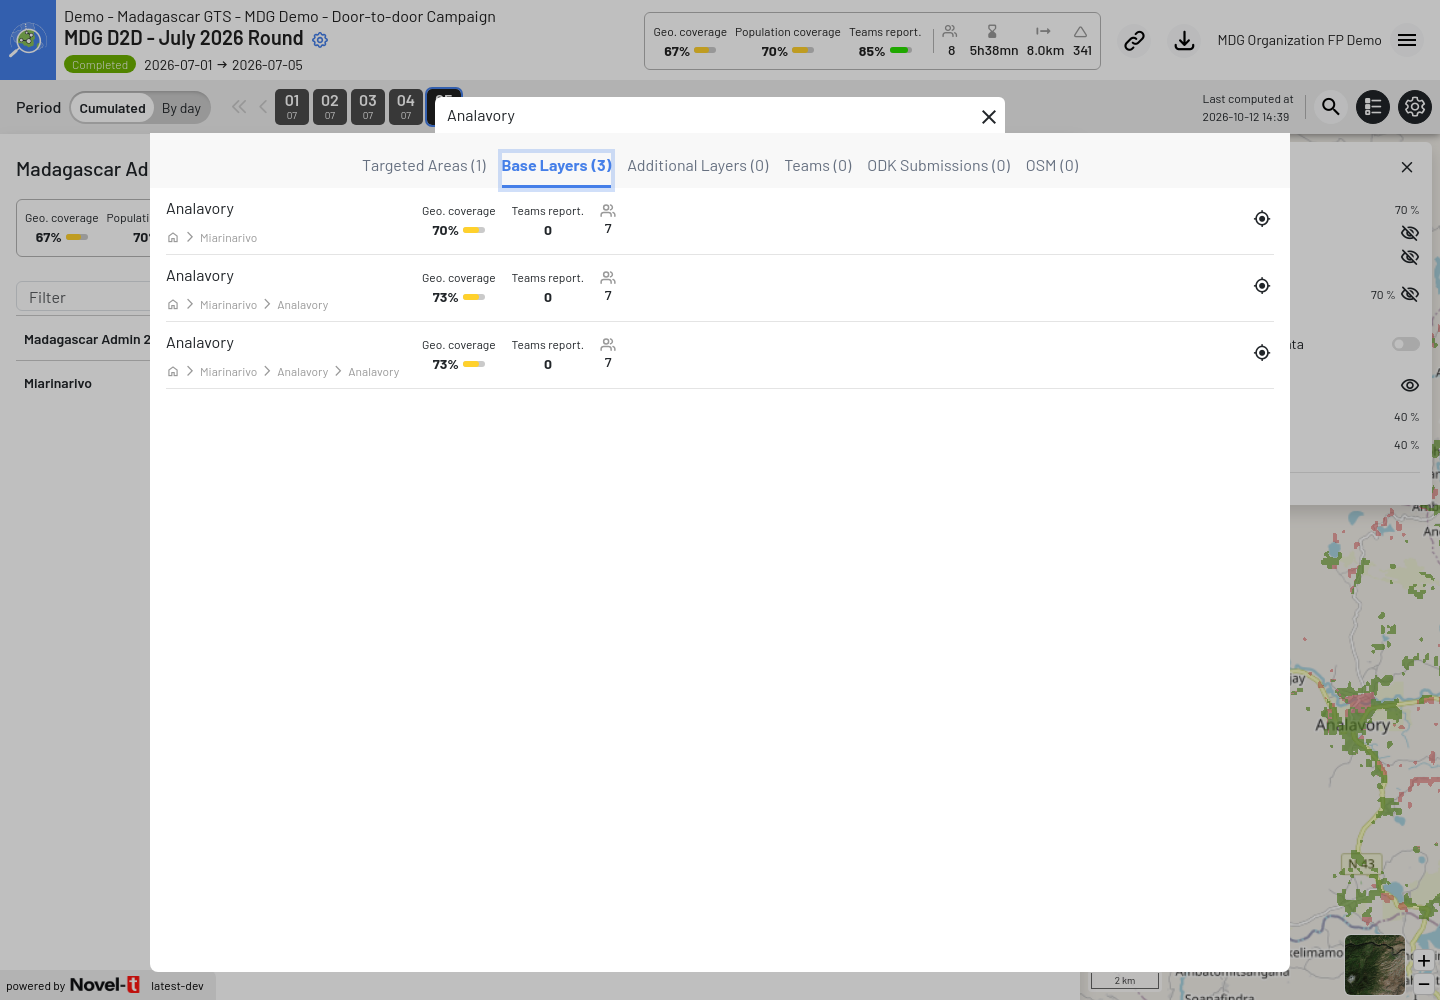
Search results for Analavory, grouped in tabs
- Data panel (list icon)
Shows or hides the data panel on the left. Drag the handle on its right edge to make it wider, or use the Fullscreen icon at its top right to show only the panel.
- Settings (gear icon)
Shows or hides the Settings panel described below.
Settings panel: choose what is displayed
The Settings panel controls the layers drawn on the map. For each layer, the eye icon shows or hides it, and the percentage opens a slider to change its opacity (the percentage is the opacity of the layer, not an indicator value).
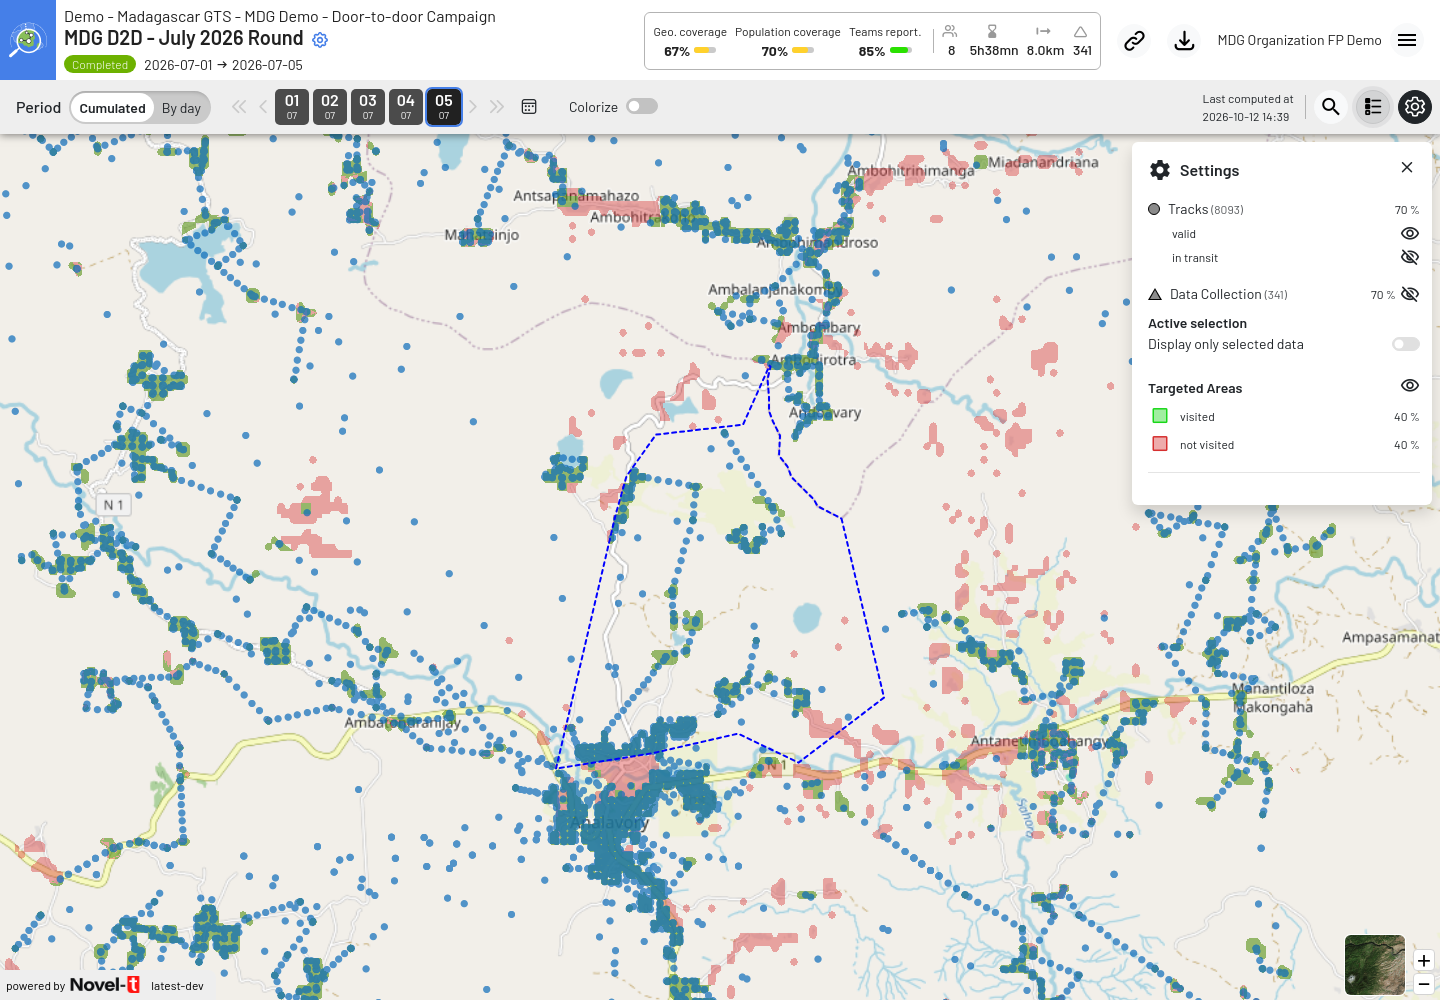
Valid tracks (dots) shown with the Settings panel, over visited (green) and not visited (red) targeted areas
- Tracks (number of points)
valid — GPS points recorded at a speed compatible with field work. Only valid points inside a targeted area are used for coverage and team indicators.
in transit — points recorded outside the speed limits of the Tracking Round (for example while travelling by car). They are drawn with a small X-shaped symbol.
When the round has targeted areas, tracks and data collection points are hidden when the map opens, to keep the map fast and readable. Show them when you need to check where a team went. In-transit points are always hidden at first.
- Data Collection (number of submissions)
Form submissions (ODK) are drawn as small triangles.
- Active selection
Display only selected data hides all tracks and submissions except those of the teams selected in the Teams view of the data panel (see Map Indicators and Panels). The switch is only active in the Teams view.
- Targeted Areas
visited (green) — targeted areas visited during the selected period.
not visited (red) — targeted areas not yet visited.
For rounds whose targeted areas are service locations (GMT microplan import), this section is replaced by Service Coverage: one icon per type of site and four colours for the share of planned visits achieved (0-25%, 25-50%, 50-75%, 75-100%). See GMT microplan import.
- Stationary Activity (when stationary activity detection is configured)
One line per detected activity type, each with its own icon and colour.
- Aggregation Areas
The base layers used to aggregate the targeted areas (for example districts and communes). Click the layer symbol to change its colours.
- Additional Layers
Other layers added by the Focal Point (for example health facility points or roads).
If a layer has no data, the panel says so (No track found, No data collection, No targeted areas uploaded).
Basemap and zoom
The basemap thumbnail at the bottom right (Change basemap) lets you choose OSM (street map), Satellite or No basemap.
The + and – buttons zoom in and out. You can also use the mouse wheel or pinch on a touch screen.
The scale bar at the bottom left shows distances.
Click a targeted area on the map to open its details: Visit dates (UTC days, see Choose the period), Visited, Duration with the Expected min. duration (only when a minimum duration is configured) and Latitude, Longitude. Clicking a track point or a data collection point shows its details in the same way: time (UTC), field staff, team code and device, plus the form answers for a submission. When several objects are under the click, use the arrows at the bottom of the window (for example 1 / 2) to move from one to the next.
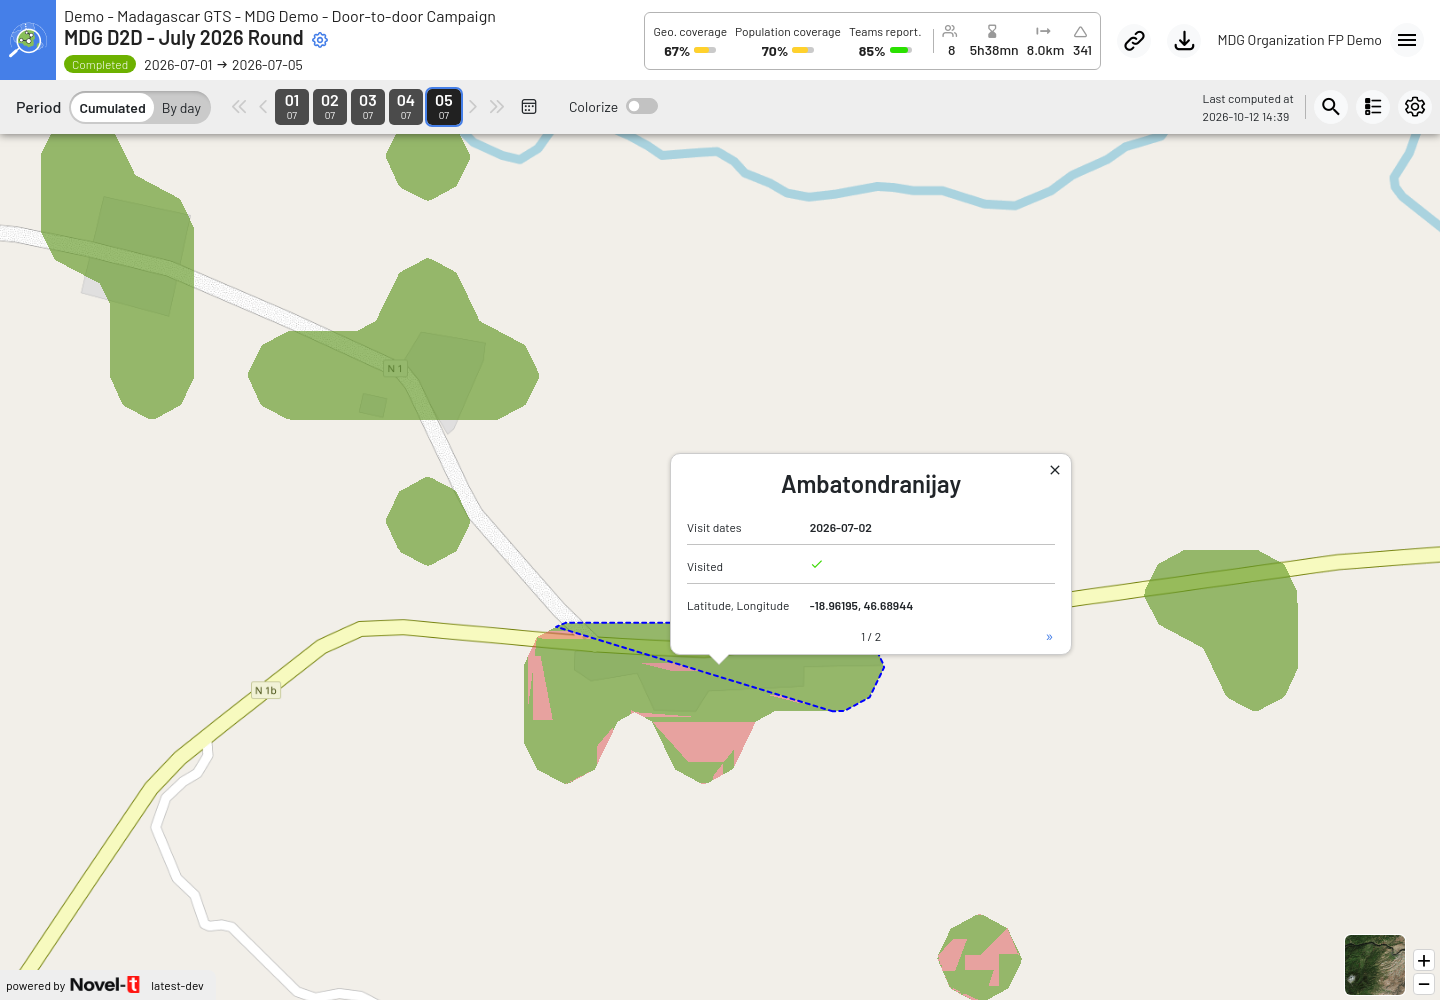
Details of a targeted area, opened by clicking it on the map
Download data
Click the download button in the header to open Download options. You can export tracks, ODK submissions, geocoverage indicators and targeted areas, either up to a selected day (Cumulated until) or for one day (Selected day only). See Downloads and GPS tracks for the available formats and Geocoverage indicators and Targeted Areas for the coverage exports.
Mobile phones and small screens
On a phone, the header is reduced to the round name and a few indicators; tap the arrow next to the name to see all of them. A bar at the bottom of the screen replaces the period bar and the map buttons:
Menu — Public link (copies the address of the map, like the link button: it is a public address only if the round has a public link), Export (the Download options window), TR Selection, Admin (Focal Points), Help and Log out. People who are not signed in only see Sign In;
Data — the data panel;
Settings — the Settings panel;
Calendar — the period selector and the day chips.
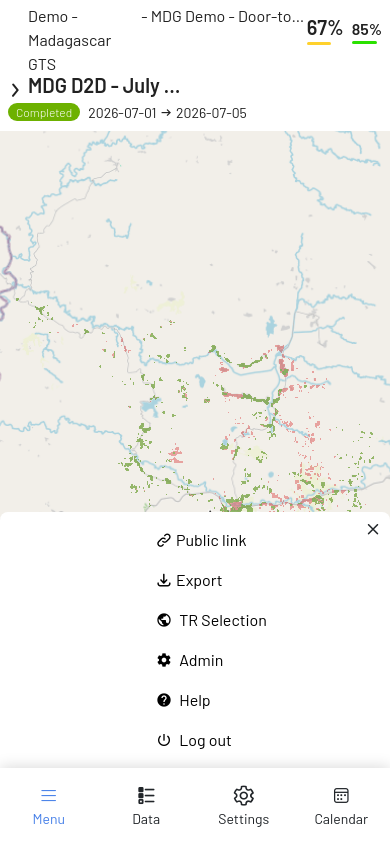
Map on a phone with the Menu of the bottom bar open