Geo-Coverage Investigation
Geo-coverage tells you how much of the planned area has been reached by field teams. When a Tracking Round has targeted areas, the data panel of the map lets you start from the whole campaign area and drill down, level by level, to the areas that were missed.
This page explains how GTS decides that a targeted area is visited and how to investigate coverage with the Areas view of the data panel. The general map layout is described in Map Overview.
Key ideas
Targeted areas
Targeted areas (TAs) are the smallest areas that teams must visit, for example settlements or localities. They are uploaded by the Focal Point in the Tracking Round administration (Targeted Areas tab).
Aggregation levels
Targeted areas are grouped into larger administrative areas called aggregation levels (base layers), from the largest to the smallest. In the MDG demo, the levels are:
Districts (Madagascar Admin 2 - Districts pilot), for example Miarinarivo;
Communes (Madagascar Admin 3 - Communes), for example Analavory;
Fokontany (Madagascar Admin 4 - Fokontany);
Localities (Madagascar Admin 5 - Localities);
the targeted areas themselves (Zones Ciblées, the last level).
Each indicator is calculated for every area of every level, so you can compare districts, then communes inside a district, and so on.
When is a targeted area “visited”?
A targeted area is visited on a day when a team recorded valid track points inside it:
Points recorded outside the speed limits of the Tracking Round (in transit, for example in a vehicle) are not used.
If the Focal Point set a Minimum duration (door-to-door configuration of the targeted areas), the team must spend at least that time inside the area on that day. A team that only crosses the area does not make it visited. If no minimum duration is set (as in the MDG D2D - July 2026 Round), one valid point inside the area is enough.
An area visited several times, or by several teams, is counted once.
Days are counted in universal time (see UTC days).
Geo. Coverage is then: number of targeted areas visited / number of targeted areas. For an area such as a district, it only counts the targeted areas inside that district. For example, in the MDG D2D - July 2026 Round, 1,334 of the 1,988 targeted areas were visited: Geo. Coverage is 67%.
Note
Geo-coverage measures presence of teams in the planned areas, based on GPS tracks. It does not prove that every household was reached or that every child was vaccinated. Use it together with field supervision, tally sheets and form submissions.
Visited and not visited on the map
On the map, targeted areas are coloured according to the selected period (see Map Overview):
green — visited during the period;
red — not visited.
In Cumulated mode, an area is green if it was visited on any day from the start of the round up to the selected day. In By day mode, it is green only if it was visited on the selected day. You can change the opacity of both colours, or hide them, in the Settings panel.
The Areas view
Open the data panel (list icon) and select Areas at the top of the panel.
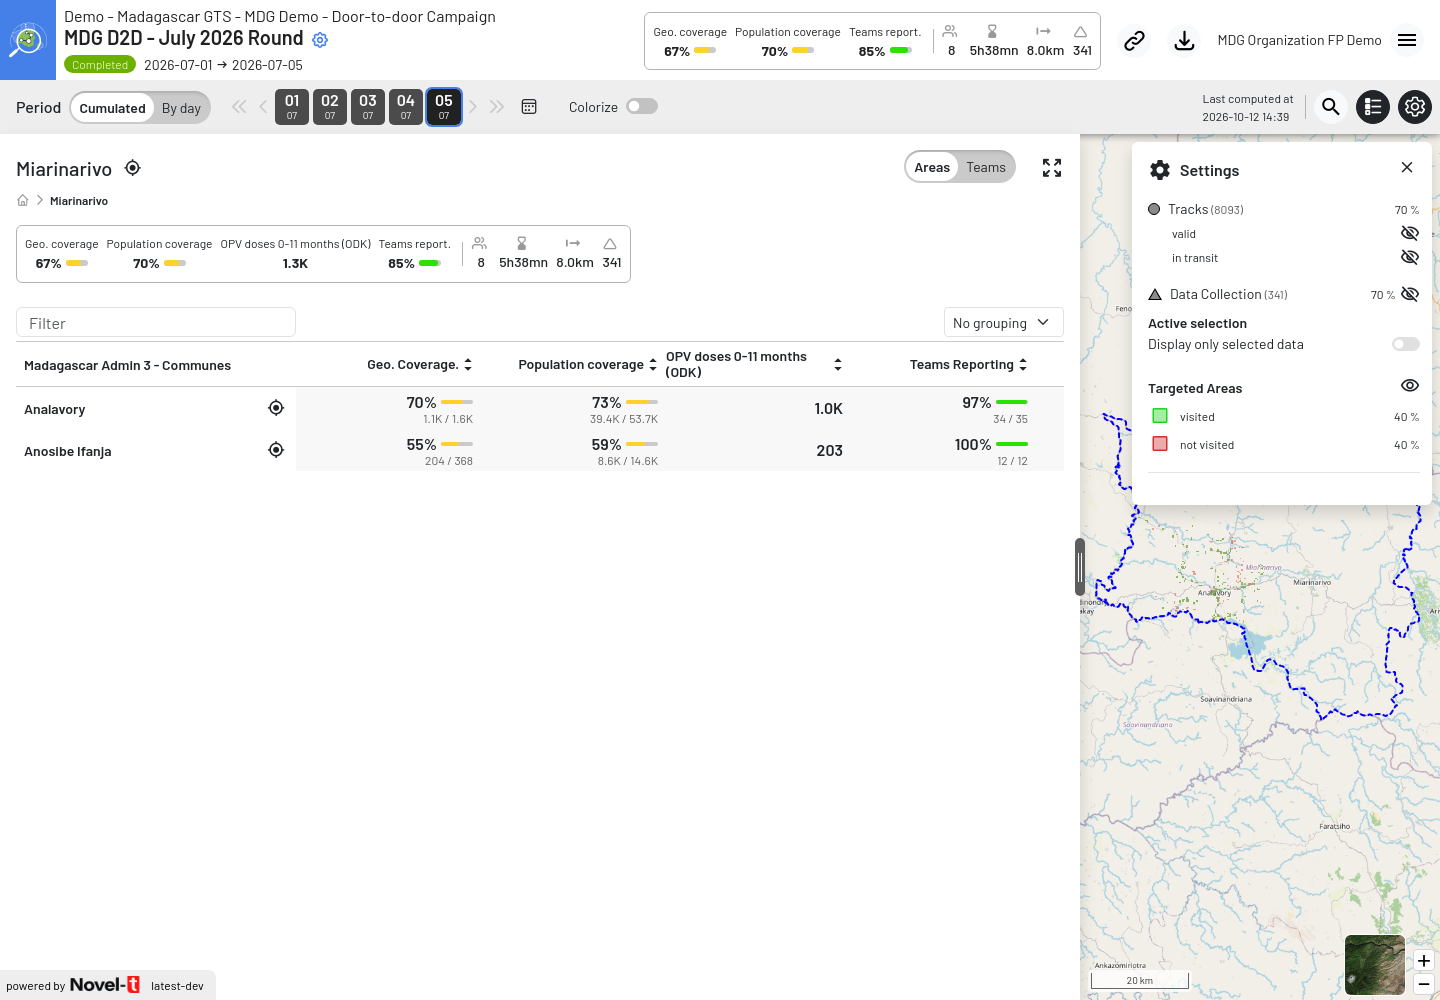
Drilldown into Miarinarivo district: the panel lists its communes, with their coverage and teams reporting (Analavory 34 / 35 planned team-days, Anosibe Ifanja 12 / 12)
From top to bottom, the panel shows:
- Title
The area you are looking at, for example Miarinarivo. At the top level, the name of the largest aggregation level is shown instead. Click the locate icon next to it (Zoom to) to fit the map to this area.
- Breadcrumb
The path from the top level to the current area, for example home icon › Miarinarivo. Click the home icon to return to the top level, or click any name in the path to go back to that level.
- Indicator summary
The indicators of the current area for the selected period (see Map Indicators and Panels).
- Filter and grouping
Type part of a name in Filter to shorten the list. The grouping list (No grouping by default) is shown when the Focal Point configured group attributes; see Map Indicators and Panels.
- Area list
The column header shows the name of the level listed (for example Madagascar Admin 3 - Communes). Each row shows an area, its locate icon, and its indicators: Geo. Coverage, any custom indicators, and Teams Reporting (not shown at the last level, nor when a grouping is selected). Under each percentage, the numbers used are shown (for example 1.1K / 1.6K for the commune Analavory; large numbers are rounded to thousands).
Sort the list
Click the arrow next to a column title to sort the areas by that indicator; click again to reverse the order. Sorting Geo. Coverage from lowest to highest puts the areas that need attention at the top.
Drill down to find missed areas
The following example looks for missed targeted areas in the MDG D2D - July 2026 Round.
Open the map of the round and the data panel, with Areas selected and Cumulated as period.
Sort the districts by Geo. Coverage, lowest first. In the demo, only Miarinarivo is listed: 67% (1.3K / 2.0K).
Click the name of the district with the lowest value, here Miarinarivo. The map zooms to the district and outlines it with a blue dashed line; the list now shows its communes: Analavory 70% (1.1K / 1.6K) and Anosibe Ifanja 55% (204 / 368).
Sort again and click a commune. Anosibe Ifanja has the lowest percentage, but Analavory has more areas left to visit (490 against 164): look at the numbers under the percentages too. Continue down the levels (fokontany, then localities). In Analavory, for example, Andranomavo (0 / 40) and Tsarazaza (1 / 45) were hardly visited and Mandrevo has only 12 of its 97 targeted areas visited, while Amparaky is complete (140 / 140).
At the last level, the list shows the targeted areas themselves. Their names are not clickable; use the locate icon to zoom to one of them.
On the map, red areas are the ones still to visit. Click one to see its details (Visit dates, Visited, and Duration when a minimum duration is set).
If needed, show the valid tracks in the Settings panel to check whether a team passed close to the area but did not stay long enough.
Use the breadcrumb to go back up and repeat for the next area.
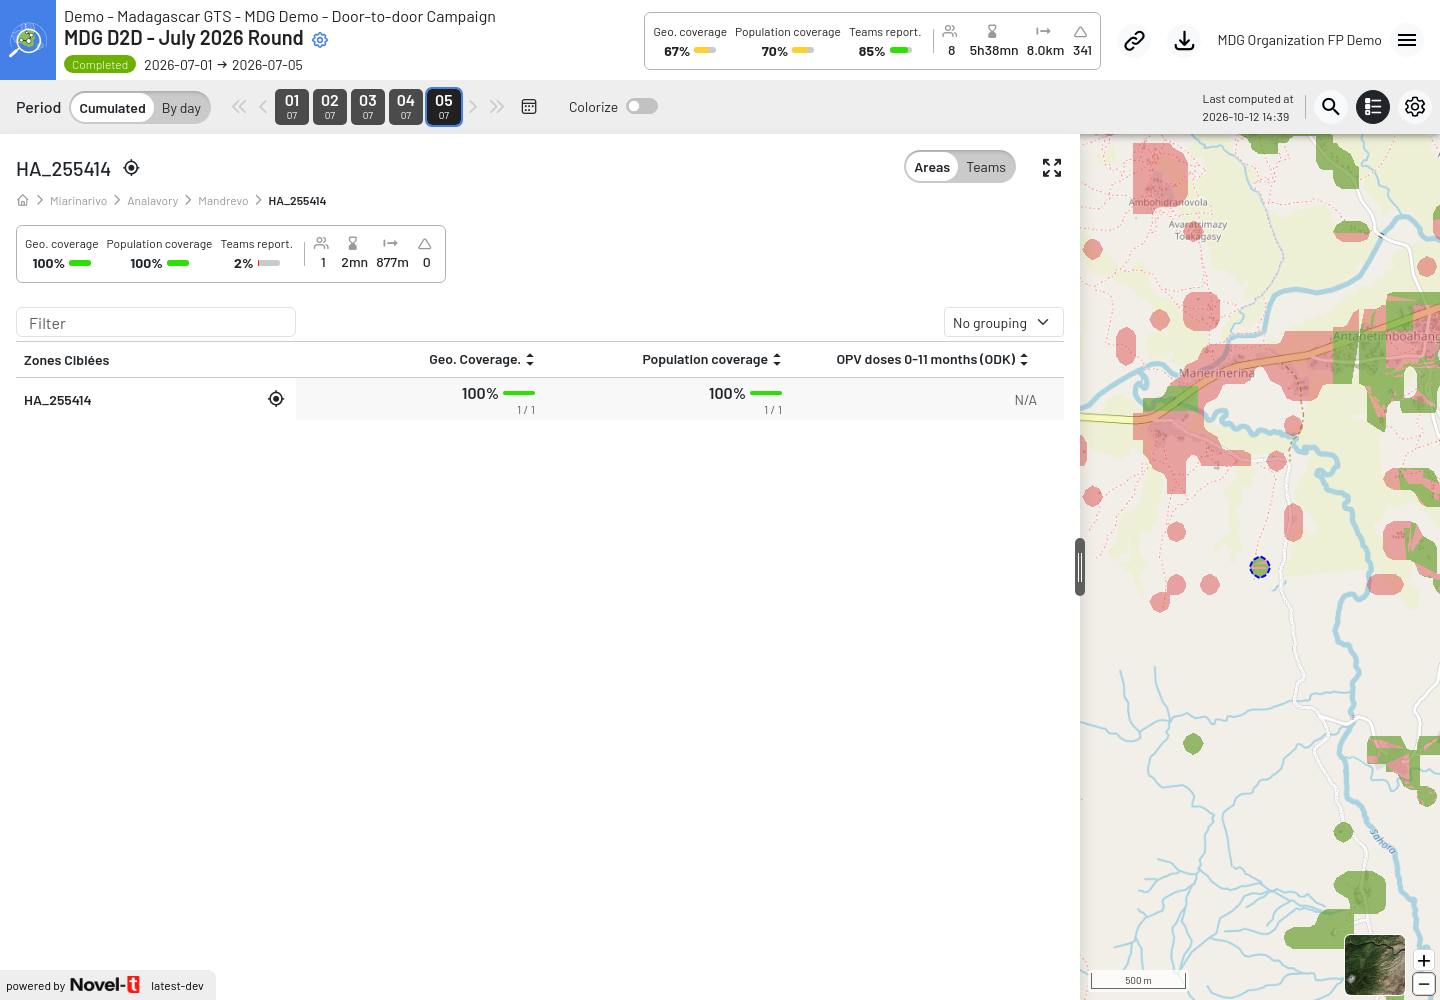
Last level of the drilldown (Miarinarivo › Analavory › Mandrevo › a locality): the list shows the targeted area of the locality, and the map shows the visited (green) and not visited (red) areas around it
Tip
The address of the page keeps the area you drilled into and the selected period. Copy it with the link button in the header to show a colleague exactly the same view (see Share the map).
Interpret what you see
- A district has high coverage but a few red areas.
The team covered most of the district. Check the red areas: they may be hard to reach, newly added, or wrongly drawn. Plan a catch-up visit if needed.
- An area is red although a team says it was there.
Show the tracks. If there are no points, the phone may not have been tracking (off, no GPS, application closed). If there are only in-transit points, the team was moving too fast. If there are points but the stay was short, the minimum duration was not reached.
- Coverage is low on the first days of the round.
This is expected in Cumulated mode. Compare with the plan: use By day to check that each day’s areas were visited as scheduled.
- Coverage did not change after new data arrived.
Check the computation status in the period bar (Last computed at). Values are updated after each computation.
- Some areas or levels cannot be opened.
The round is archived: only final indicators were kept, so the lowest levels are not available. Ask the GTS team if the detailed indicators are needed; tracks and form submissions can still be downloaded (see Downloads and GPS tracks).
To export the visited and not visited areas (for example to prepare a missed-settlement list, see Get the missed settlement list), use the download button in the header and follow Geocoverage indicators and Targeted Areas.