Create a Targeted Areas layer
Introduction
In the GTS, areas targeted by a Field Activity essentially consist in a geospatial microplan (i.e. a polygon layer with each polygon in the layer being targeted for geospatial tracking by the Field Activity). Polygon layers containing the Targeted Areas are typically created outside of the GTS (e.g. using GeoPoDe, GMT, QGIS, ArcMap, etc.). This document describes how the Targeted Areas layer is typically created for polio house to house campaigns which target settlements. Since the settlement extents (polygons) can be quite big, they are divided into grids 50x50 or 100x100 meters or so. The resulting Targeted Areas layer can then be uploaded to the GTS which, in turn, will compute settlement-level geographic coverages to enable the identification of partially covered as well as missed settlements. This document describes, step-by-step, how to create a Targeted Areas layer that can be used in the GTS (http://gts.health), with the well-known QGIS application.
Context
This documentation illustrates how to create a Targeted Areas layer that will be uploaded to the GTS to monitor and evaluate a polio vaccination campaign taking place in Nigeria, Lagos State, Badagry LGA, Ajido and Iworo-Gbanko wards. Note that polio campaigns target children under 5 years of age.
Caution
Do not mix the areas targeted by a campaign with the areas targeted for GTS tracking, the latter being usually a sub-set of all areas targeted by the campaign, based on the number of tracking devices available to geospatially monitor vaccination teams.
Prerequisites
We assume you already installed QGIS version 3.28.3-Firenze or above for your operating system from the official website. We also assume that you have basic knowledge in GIS and have internet to download the sample data, mentioned in this document.
Quick overview
The following steps will be performed to create the Targeted Areas layer:
Download the necessary geospatial data (i.e. settlement extents, boundaries and GIS-based target population estimates)
Add the downloaded geospatial data to QGIS
Assemble the settlement extents that are targeted for geospatial tracking by your Field Activity
Grid the settlement extents to grid cells to enable settlement-level geographic coverages in the GTS
Add target population estimates to the grid cells
Fine tune the Targeted Areas layer
Export the final Targeted Areas layer as a Shapefile
Step 1 - Download the necessary geospatial data
Settlement extents and boundaries (shapefiles)
To create the Targeted Areas layer, we need shapefiles containing the settlement extents as well as the country boundaries. In this example the settlement extents are classified into three types: the Built-Up Area (aka urban cities), the Small Settlement Areas (aka rural villages) and Hamlet Areas (group of hamlets with few households). The corresponding shapefiles are freely available on GeoPoDe (https://geopode.world/):
On the GeoPoDe landing page, select Nigeria (direct link: https://nga.geopode.world/)
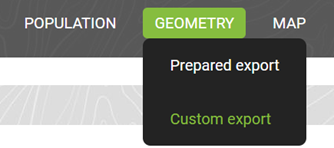
Click on “Geometry”
Hover the “Geometry” menu in the top navigation and choose “Custom export”
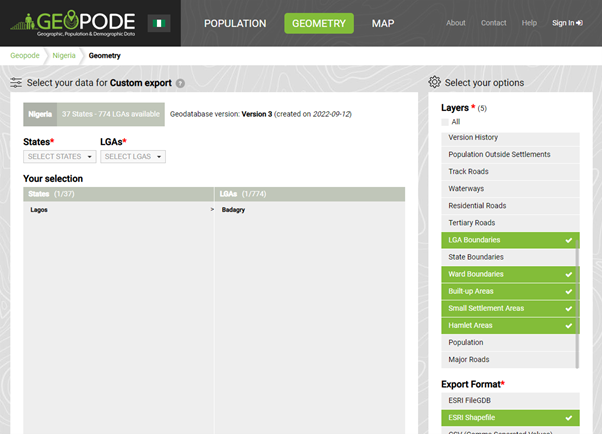
In the “States” dropdown, select “Lagos”
In the “LGAs” dropdown, click “Undo All” and then select “Badagry”
In the “Layers” panel, select the following layers:
“LGA Boundaries”
“Ward Boundaries”
“Built-up Areas”
“Small Settlement Areas”
“Hamlet Areas”
In the “Export Format” panel, select “ESRI Shapefile”
At the bottom of the screen, put your email address and press the “Request Export” button.
You should receive an email few minutes later with a link to download a zip file containing the requested data.
GIS-based target population estimates (raster)
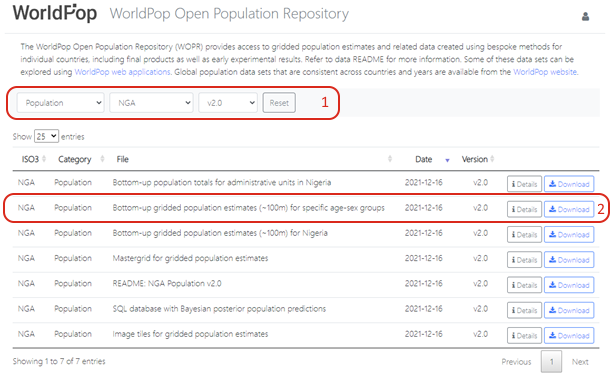
To get an estimate of the target population (i.e. children under 5 years of age), we will download a 100m resolution raster (.tif file) containing gridded population estimates from the Worldpop website:
Select the filters as follow (cf. point 1 in the screenshot below):
“Category”: “Population”
“Country”: “NGA” (Nigeria)
“Version”: “2.0”
Click the “Download” button next to the “Bottom-up gridded population estimates (~100m) for specific age-sex groups” (cf. point 2 in the screenshot below)
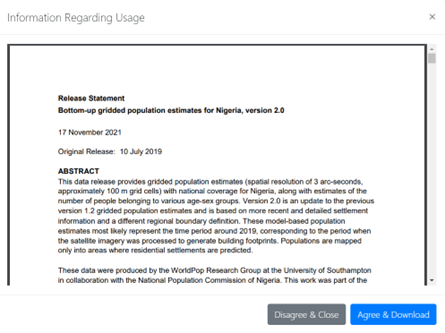
On Information Regarding Usage popup, click Agree & Download.
Caution
The zip file contains various type of population estimates and is quite big (more than 1GB). In our example, only the file NGA_population_v2_0_agesex_under5.tif will be useful, but unfortunately WorldPop website does not provide an option to download this file only.
Step 2 - Add the downloaded geospatial data to QGIS
Prepare you QGIS project
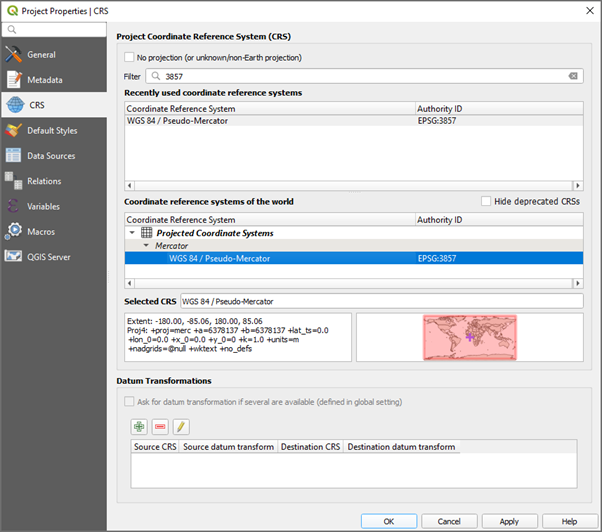
Click on Project > Properties
Under “CRS”, type “3857” in the “Filter”
Select “WGS 84 / Pseudo Mercator (EPSG:3857)
Click Ok.
Add the downloaded shapefiles
Caution
Make sure to unzip the downloaded shapefiles first, to enable editing and manipulation in QGIS.
Click on Layer > Add Layer > Add Vector Layer
Under “Source”, click the Browse (“…”) button next to “Vector Dataset(s)”, browse to the location where you unzipped the downloaded shapefiles, select the file LGA shapefile (GEOPODE_GEOMETRY_EXPORTboundary_lgas_exportboundary_lgas_export.shp)
Click “Open”
Click “Add”
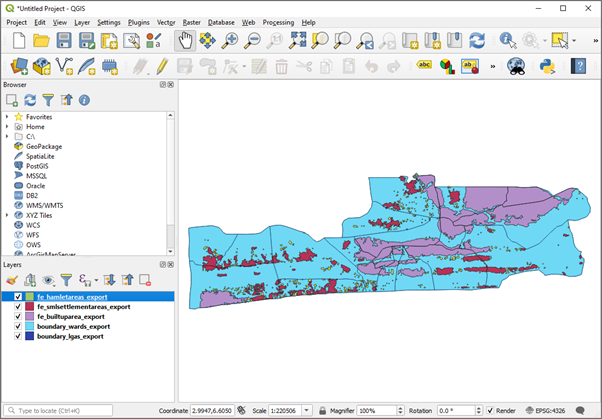
Repeat the steps above from step 2 for the Wards, Built-up Areas, Small Settlement Areas and Hamlet Areas shapefiles (i.e. boundary_wards_export.shp, fe_builtuparea_export.shp, fe_smlsettlementareas_export.shp, and fe_hamletareas_export.shp)
Click “Close”
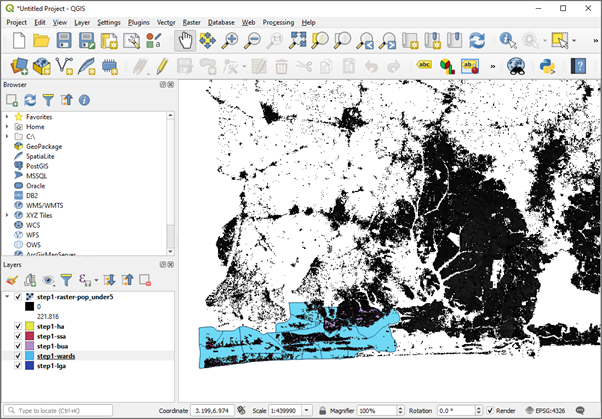
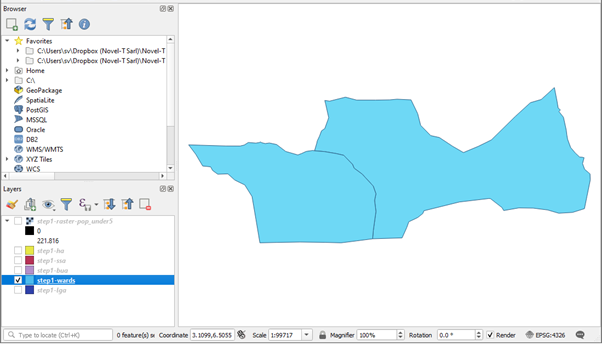
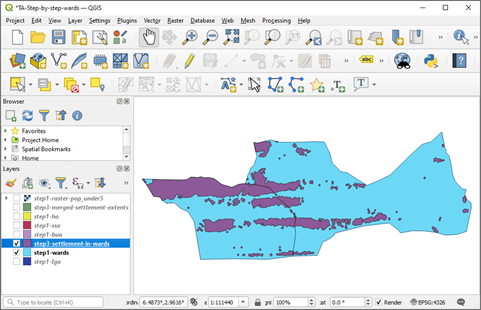
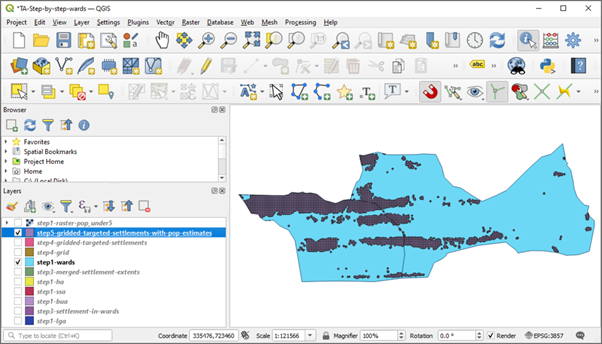
Once done you should see the following (the colors of the five layers may differ).
Note
The LGA layer should not be visible if you imported the layers in the order specified above, as the Ward layer should be on top of the LGA layer.
Add the downloaded raster
Caution
Make sure to unzip the downloaded raster files first, to enable editing and manipulation in QGIS.
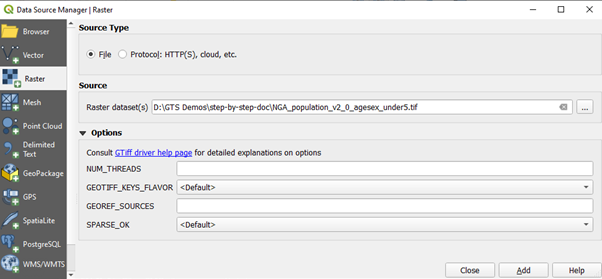
Click Layer > Add Layer > Add Raster Layer
Under “Source”, click the Browse (“…”) button next to “Raster Dataset(s)”, browse to the location where you unzipped the downloaded rasters, select the file which contains the under 5 population estimates (NGA_population_v2_0_agesex/NGA_population_v2_0_agesex_under5.tif)
Click “Open”
Click “Add”
Click “Close”
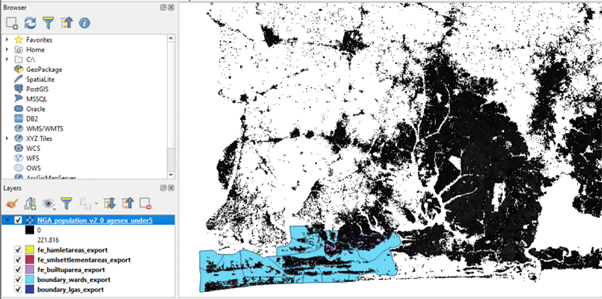
Note
The raster contains under 5 population estimates at a 100m resolution for the whole of Nigeria.
Rename the layers
In the “Layers” panel, right click on each layer, click “Rename Layer” and rename the layers as follow:
Rename “boundary_lgas_export” to “step1-lga”
Rename “boundary_wards_export” to “step1-wards”
Rename “fe_builtuparea_export” to “step1-bua”
Rename “fe_smlsettlementareas_export” to “step1-ssa”
Rename “fe_hamletareas_export” to “step1-ha”
Rename “NGA_population_v2_0_agesex_under5” to “step1-raster-pop_under5”
Step 3 - Assemble the settlement extents targeted for GTS tracking
Select the Wards in which GTS will be implemented
Let us assume that the GTS will be implemented in 2 Wards in Badagry LGA, namely in Ajido and Iworo-Gbanko Wards. Since the downloaded Ward boundary layer contains all Wards of Badagry LGA, we need to filter out the settlement extents which are outside of the 2 Wards targeted for geospatial tracking. To do so:
In the “Layers” panel, uncheck all the layers except “step1_wards”
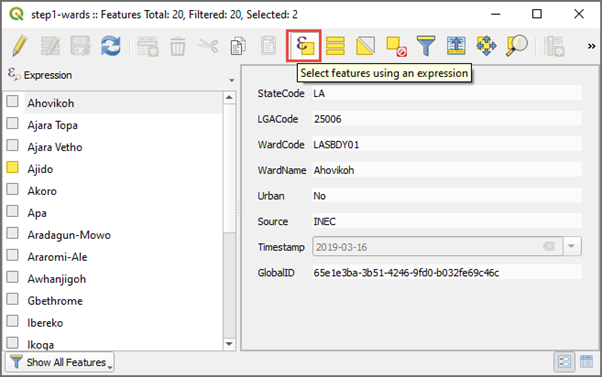
Right click on step “step1_wards” layer and click on Open Attribute Table
Click the “Select features using an expression”
 icon
icon
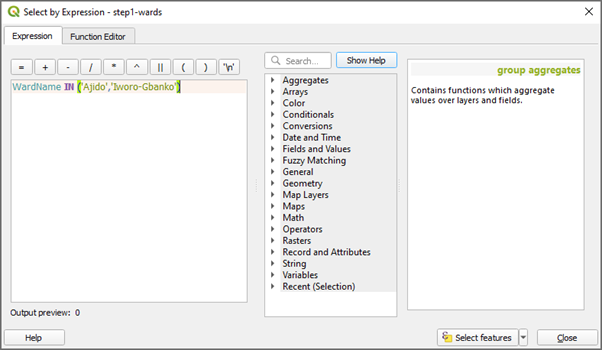
In the “Select by Expression” window, type WardName IN (‘Ajido’,’Iworo-Gbanko’)
Press “Select features” and click “Close”
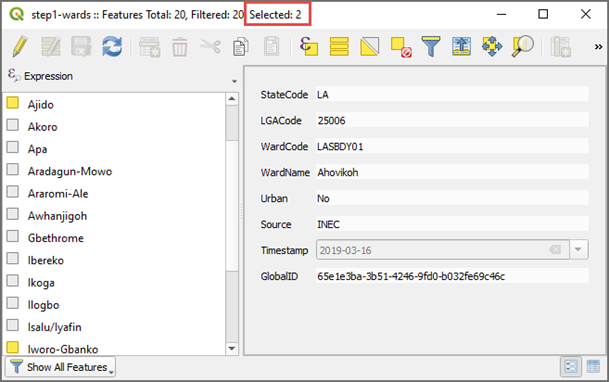
Note
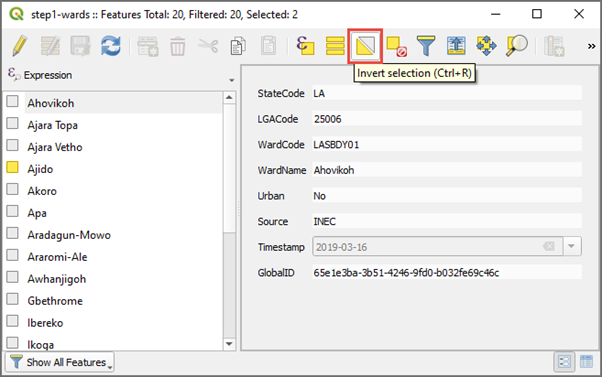
Notice the 2 Wards, out of all 20 Wards in Badagry LGA, are now selected.
Click the “Invert selection”
 icon (all 18 Wards which are not going to implement GTS should now be selected/in yellow on the map)
Click the “Toggle editing mode”
 icon and click the “Delete selected features”
  icon
iconIf prompted, confirm the deletion, save and exit the edit mode by clicking the “Toggle editing mode” icon again
The Ward boundary layers now contains only the 2 Wards in which GTS will be implemented
Add a settlement type column to each settlement extents layer
Including the type of settlement in the Targeted Areas layer will enable polio monitoring and evaluation officers to analyze at the overall geographic coverage as well as the geographic coverage per settlement type, via the GTS. To do so:
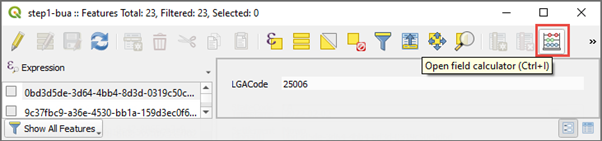
In the “Layers” panel, right click on the “step1-bua” layer and select “Open Attribute Table”
Click the “Open field calculator”
 icon
icon
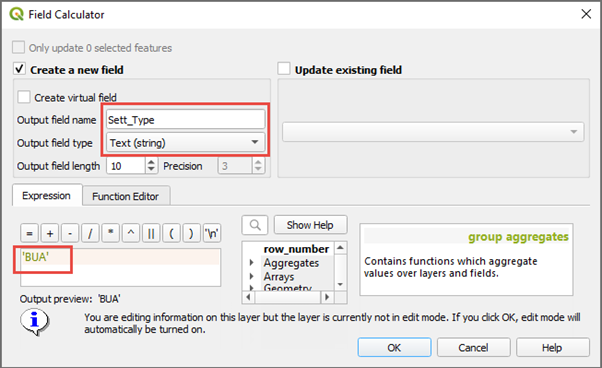
Set the “Output field name” to “Sett_Type”
Set the “Output field type” to “Text (string)”
Set the “Expression” to ‘BUA’ (with the single quotes - the “Output preview” should read ‘BUA’)
Click “OK”, save and exit the edit mode by clicking the “Toggle editing mode” icon
Repeat the steps above with the “step1-ssa” layer and by setting the “Expression” to ‘SSA’
Repeat the steps above with the “step1-ha” layer and by setting the “Expression” to ‘HA’
Intersect the settlement extents with the ward boundaries
As a reminder, the Ward layer contains only 2 Ward boundaries now, which correspond to the areas where GTS will be implemented. In this step, we filter out the settlement extents which are not in within the 2 Wards which are targeted for GTS tracking. To do so:
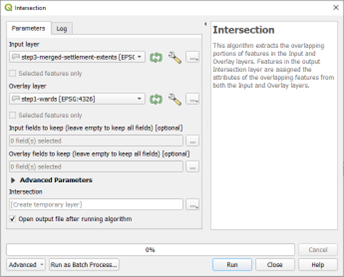
Click on Vector > Geoprocessing Tools > Intersection…
Set the layer “step1-bua” as the Input Layer
Set the layer “step1-wards” as the “Overlay layer”
Click “Run” and, once completed, click “Close”
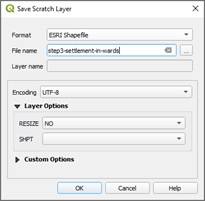
Right click on the resulting “Intersection” Layer, click “Make Permanent” and name it “step3-settlement-in-wards-bua”
In the “Layers” panel, right click on the “Intersection” layer, click “Rename Layer” and rename it to “step3-settlement-in-wards-bua”
Repeat the steps above for the step1-ha layer and create a step3-settlement-in-wards-ha layer.
Repeat the steps above for the step1-ssa layer and create a step3-settlement-in-wards-ssa layer.
Step 4 - Grid the settlement extents (aka grid cells) to enable settlement-level geographic coverages in the GTS
Caution
If you did not set the project with the WGS 84/Pseudo Mercator (EPSGi 3857) CRS option, the field units will not be in meters but in degree (see section 4.1 for more details).
Create a grid layer
Caution
The grid size depends of the Settlement type:
For the Built-Up Area (aka urban cities), you can use 50x50 meters grid.
For the Small Settlement Areas (aka rural villages), you can use 100x100 meters grid.
For the Hamlet Areas (group of hamlets with few households), you can use 150x150 meters grid.
Click on Vector > Research Tools > Create Grid
Select Rectangle (Polygon) on the Grid Type field.
On the Grid extent field, click on the down arrow, select Calculate from Layer and select one of the 3 settlement extents (step3-settlement-in-wards-bua, step3-settlement-in-wards-ssa or step3-settlement-in-wards-ha)
Set the Horizontal spacing and Vertical spacing with the expected grid size mentioned above.
Click Run and Close when the process is completed
Right click on the resulting “Grid” Layer, click “Make Permanent”, name it to:
“step4-grid-bua” if you gridded the bua layer.
“step4-grid-ssa” if you gridded the ssa layer.
“step4-grid-ha” if you gridded the ha layer.
Right click on the “Grid” layer again, click “Rename Layer” and rename it to:
“step4-grid-bua” if you gridded the bua layer.
“step4-grid-ssa” if you gridded the ssa layer.
“step4-grid-ha” if you gridded the ha layer.
Only keep the grid cells which intersect the settlements targeted for GTS tracking
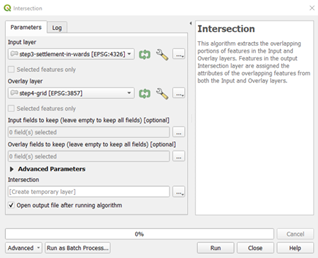
From the top menu, select on Vector > Geoprocessing Tools > Intersection…
Set the layer “step3-settlement-in-wards-bua” as the “Input Layer”
Set the layer “step-4-grid-bua” as the “Overlay layer”
Click “Run” and, once completed, click “Close”
Right click on the resulting “Intersection” Layer, click “Make Permanent”, name it “step4-gridded-targeted-settlements-bua”
Right click on the “Intersection” layer again, click “Rename Layer” and rename it to “step4-gridded-targeted-settlements-bua”
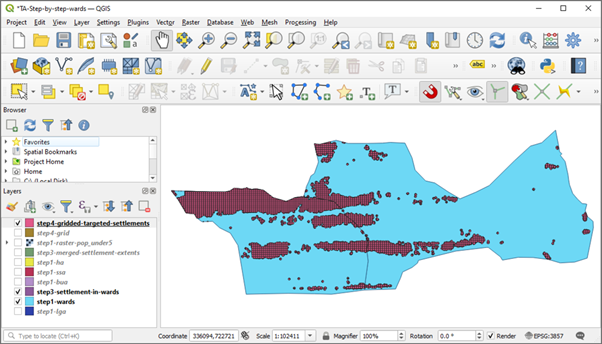
repeat the process for the -ssa and -ha layers.
Merge the three gridded settlement extents layers into one
Tip
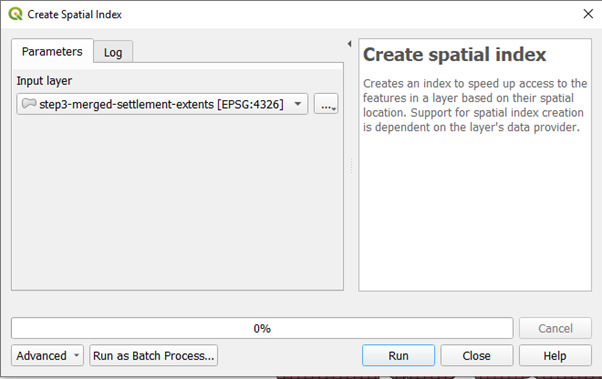
Vector manipulation can consume a lot of computer resources. To get better performances you can create a Spatial Index on each layer.
Click on Vector > Data Management Tools > Create Spatial Index…
In the Input layer field, select the layer for which you want to create a spatial index
Click Run
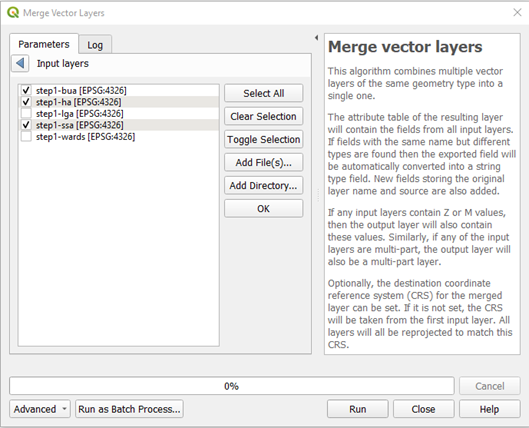
Since the GTS can accommodate one Targeted Areas layer per Tracking Round, we need to merge the BUA, SSA and HA layer into one. To do so:
Click on Vector > Data Management Tools > Merge vector Layers…
Under “Input layers”, select the 3 settlement extents layers (i.e. “step4-gridded-targeted-settlements-bua”, step4-gridded-targeted-settlements-ssa” and step4-gridded-targeted-settlements-ha”)
Click “Run” and, once completed, click “Close”
A new layer named Merged should be visible in your list of Layers. It contains the data of the 3 settlement extents layers. Rename and save it as step4-gridded-targeted-settlements
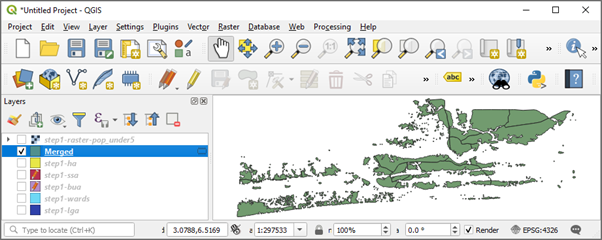
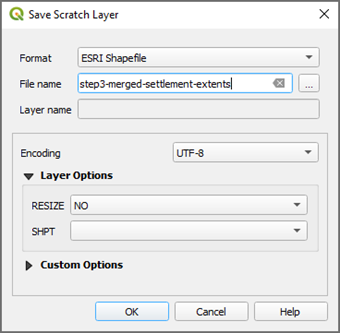
Warning
This new Merged Layer is currently not saved to your computer. If you close QGIS before saving it, the Merged layer will remain visible but will be empty. To make it permanent, right click on the layer name, click Make Permanent, set the “File Name” to “step3-merged-settlement-extents” and click OK. Then rename the layer to “step3-merged-settlement-extents”.
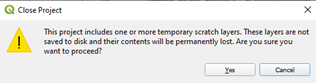
Note
If you forget to save a temporary Layer, QGIS will display a warning popup and ask you to confirm you understand that data will be lost.
Step 5 - Add target population estimates to the 100x100m grid cells
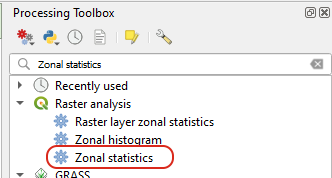
From the top menu, select Processing > Toolbox, search for Zonal Statistics and double click on “Zonal statistics”
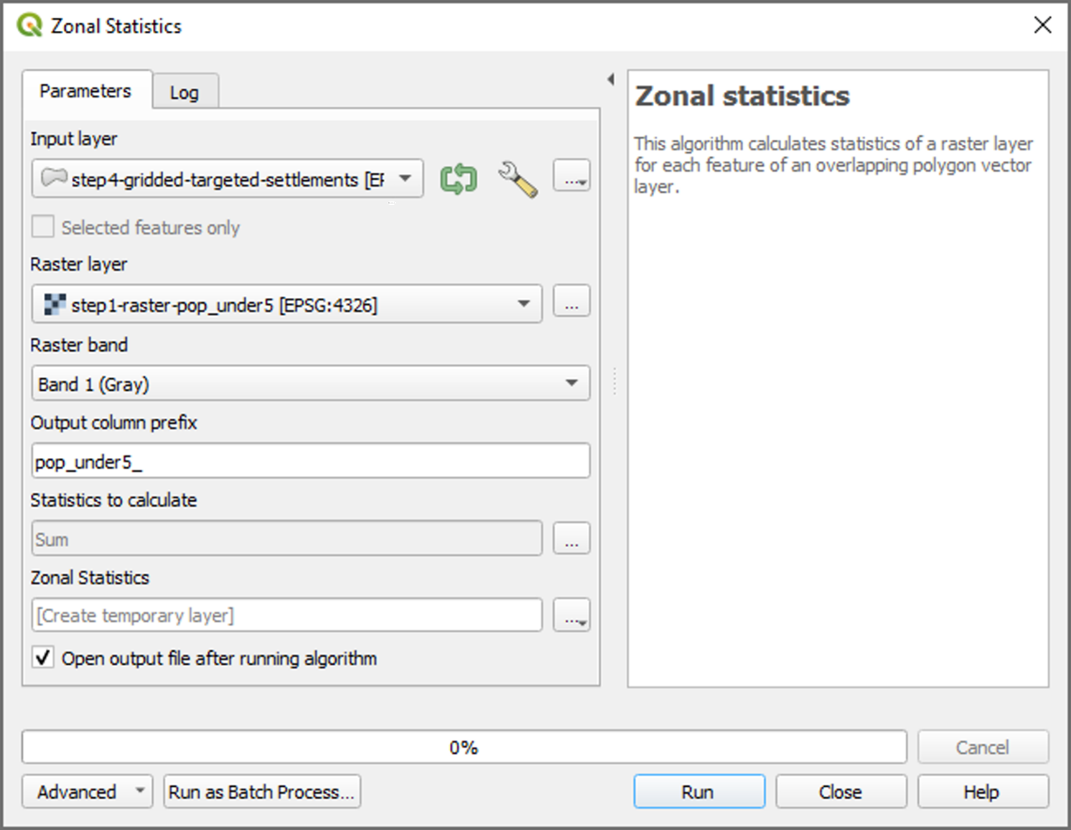
Set the layer “step-4-gridded-targeted-settlements” as the “Input Layer”
Set the layer “step1-raster-pop_under5” as the “Raster layer”
Set the Output column prefix to “pop_under5_”
In Statistics to calculate, click on the button with ellipsis (…) and choose the Sum checkbox only (remove the other values that are preselected)
Press Run and Close when the process is completed
Right click on the resulting “Zonal Statistics” Layer, click “Make Permanent”, name it “step5-gridded-targeted-settlements-with-pop-estimates”
Right click on the layer again, click “Rename Layer” and rename it to “step5-gridded-targeted-settlements-with-pop-estimates”
Tip
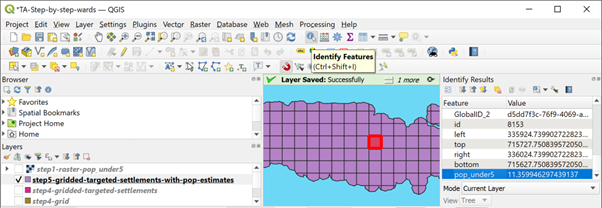
If you do not see the Processing Toolbox on your screen, you can enable from the top menu. Simply select View > Panels and click the Processing Toolbox checkbox. You can validate that the target population estimates have been added as follow:
Under layers, select the layer named “step5-gridded-targeted-settlements-with-pop-estimates“
Click the “Identify Features”
 icon in the toolbar
Click on any grid cell
In the “Identify Results” panel you should, the attribute “pop_under5” contains the estimated target population for that grid cell
Step 6 – Fine tune the Targeted Areas layer
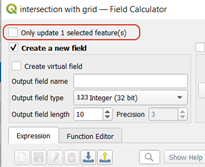
Caution
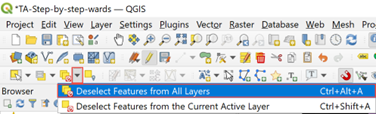
When creating a new field, make sure that no features are selected otherwise values for the new field will be set for the selected features only.
Round-up the target population estimates
In the “Layers” panel, right click on the “step5-gridded-targeted-settlements-with-pop-estimates” layer and select “Open Attribute Table”
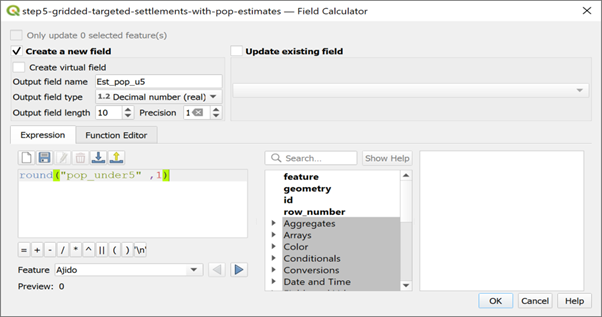
Click the “Open field calculator”
iconSet the “Output field name” to “Est_pop_u5”
Set the “Output field type” to “Decimal number (real)”
Set the “Precision” to “1”
Set the “Expression” to “round(“pop_under5” ,1)” (just the text without the double quotes)
Click OK
Remove grids cells containing very few target population estimates
In the “Layers” panel, right click on the “step5-gridded-targeted-settlements-with-pop-estimates” layer and select “Open Attribute Table”
Click the “Select/filter features using form”
 icon
iconNext to “Est_pop_u5”, specify “0.5” and select “Less than (<)” (instead of “Equal to (=)”)
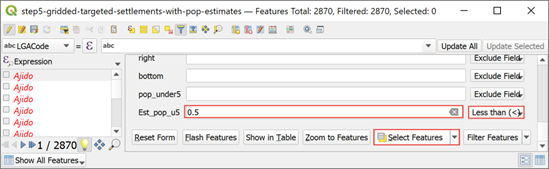
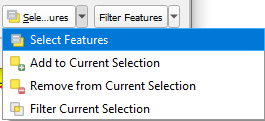
Scroll all the way down and click “Select Features”
Click the “Delete selected features”
icon
Keep relevant columns/attributes only
The GTS will allow you to map some of your attributes to the web interface. For ease of use, we will keep the relevant ones only.
In the “Layers” panel, right click on the “step5-gridded-targeted-settlements-with-pop-estimates” layer and select “Open Attribute Table”
Click on the “Delete field”
 icon (if you do not see it click the “Toggle editing mode” icon first )
Select all fields except the following ones which we are going to keep
Settlement
Sett_Type
Est_pop_u5
Press the Ok button to delete the fields
Add a unique ID column
The GTS needs a unique ID. To add one:
In the “Layers” panel, right click on the “step5-gridded-targeted-settlements-with-pop-estimates” layer and select “Open Attribute Table”
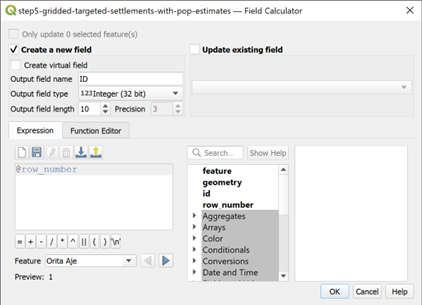
Click the “Open field calculator”
iconSet the “Output field name” to “ID”
Set the “Output field type” to “Integer (32 bit)”
Set the “Expression” to “@row_number” (just the text without the double quotes)
Click OK
Step 7 - Export the final Targeted Areas layer as a Shapefile
Export the finalized Targeted Areas layer to be uploaded to the GTS:
In the “Layers” panel, right click on the “step5-gridded-targeted-settlements-with-pop-estimates” layer and Export > Save Features As…
Set the Format field to ESRI Shaprefile
Click the Browse (“…”) button next to “File name” to choose a folder on your computer
Set the File name to “Final_TA-Polio-NGA_Under5”
Click OK
Note
After saving, you should get 6 files:
Final_TA-Polio-NGA_Under5.cpg
Final_TA-Polio-NGA_Under5.dbf
Final_TA-Polio-NGA_Under5.prj
Final_TA-Polio-NGA_Under5.qmd
Final_TA-Polio-NGA_Under5.shp
Final_TA-Polio-NGA_Under5.shx
To upload them to the GTS, you need to create a zip file containing all 6 the files.