Routine Immunization monitoring
Routine Immunization (RI) is delivered all year round, through three strategies:
the fixed strategy: children are vaccinated at the health facility (HF);
the advanced (outreach) strategy: HF staff travel to villages too far from the HF to hold vaccination sessions there;
the mobile strategy: dedicated teams reach remote or special populations.
The outreach and mobile strategies are where most zero-dose children are found, and also where planned sessions are most easily cancelled or shortened without anyone noticing. GTS helps EPI focal points and district supervisors check that the planned sessions take place, in the planned localities, as often as planned, and review it month after month.
This page shows how the GTS features fit together for RI, using the MDG Demo - Routine Immunization Field Activity and its MDG RI - Q3 2026 Microplan Tracking Round (1 July to 30 September 2026) of the MDG demo.
The RI monitoring cycle
Step |
What happens in GTS |
Main page |
|---|---|---|
1. Plan |
Each HF validates the list of localities it will visit and the number of visits (auto microplanning), or a microplan prepared in GMT is imported. |
|
2. Configure |
The Tracking Round is set up to detect visits: door-to-door presence in the localities, stationary sessions, expected teams. |
This page |
3. Track |
HF staff and outreach teams carry a phone with GTS Tracker running during their working hours. |
|
4. Review |
Supervisors review on the map, by month, week or day, which localities were reached and which sessions were held. |
This page |
5. Report |
Indicators are exported or published to Power BI for programme reviews. |
Why a Tracking Round per period? A Tracking Round has fixed dates and a fixed list of targets. For RI, a quarter (as in the MDG demo) or a month is a practical period: it matches the microplanning cycle and keeps the review manageable. The next period starts with a new Tracking Round and, if needed, a new microplan. If both rounds use the same health facility and locality layers, apply the microplans of the current round before generating those of the next one: generating replaces the microplans stored for these layers (see Auto Microplanning (Administrators)).
1. Plan the outreach sessions
GTS measures what was done against a plan. For RI, the plan is the list of localities each HF must visit in outreach and the number of visits planned in each of them.
With auto microplanning, GTS proposes to each HF the localities to visit (those too far from the HF to come to the fixed post), the HF reviews and validates its list, and GTS applies the validated microplans to the Tracking Round:
the Targeted Areas of the Tracking Round become the localities selected by the HFs, so that coverage is measured against what the HFs committed to;
the expected number of teams in Teams Deployment is set to the number of planned visits, for each locality and summed for each HF and administrative area;
each HF receives its validated microplan as a PDF and Excel file.
In the MDG demo, each HF plans 12 outreach sessions for the quarter. See Auto Microplanning (Administrators) for the configuration, Reviewing your Health Facility Microplan for the HF review and Validated Microplans and Exports for the microplan documents.
If the microplan is prepared outside GTS, in GMT, it can be imported as the Targeted Areas instead; see GMT microplan import.
2. Configure visit detection
RI teams work in two ways, and GTS can detect both in the same Tracking Round (Targeted Areas tab, 2. Strategy & Configuration):
Door to door, for outreach teams that walk through the locality: the locality is visited when a team spends at least the minimum duration inside it on a given day (15 minutes in the MDG demo). See Door-to-door campaigns.
Stationary activity detection, for sessions held at one place (a school, a church, a community site, or the HF itself): GTS detects the places where a team stayed long enough and, with the Geocoverage option, counts the localities within the catchment radius of the site as visited. See Stationary campaigns and fixed posts.
The MDG RI demo uses the configuration of the Madagascar programme and combines both: door-to-door with a 15-minute minimum and stationary activity detection with a 60-minute minimum visit, Geocoverage enabled and two rules:
Centre de santé de base (the health facility, fixed strategy): a site visited on at least 4 days, with a 5,000 m catchment radius, marked Health Facility;
Séance avancée (outreach session): a site visited on at least 1 day, with a 2,000 m catchment radius.
When both strategies are enabled, the time spent at a site is counted once, so team durations are not inflated.
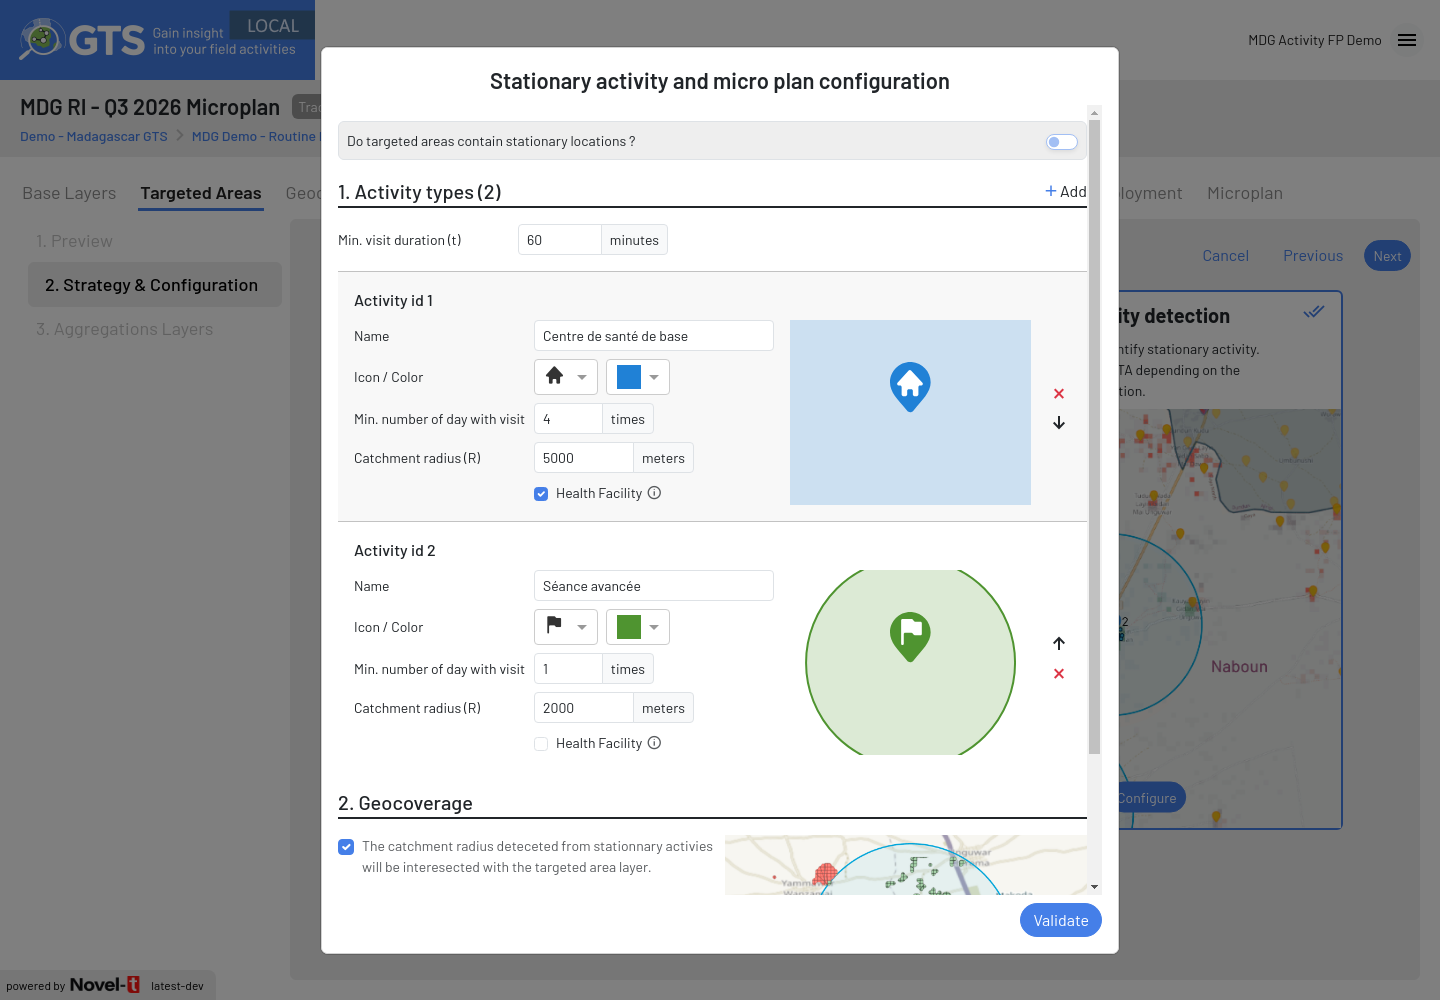
Stationary activity detection rules of the MDG RI demo Tracking Round: Centre de santé de base (4 days, 5000 m, Health Facility) and Séance avancée (1 day, 2000 m), 60 minutes minimum visit duration and Geocoverage enabled
With these rules, the MDG RI demo detects 3 Centre de santé de base sites (the three health facilities, each visited on 10 days) and 12 Séance avancée sites (one outreach session each).
Tip
Mark the rule that represents HFs as Health Facility. The stationary activity export then gives, for each outreach site, the distance to the closest HF of the team: a useful check that outreach sessions really take place away from the HF.
3. Plan the teams
The Teams Deployment tab of the Tracking Round holds the number of teams expected in each area. GTS compares it with the teams that actually worked there, in the Teams report. indicator.
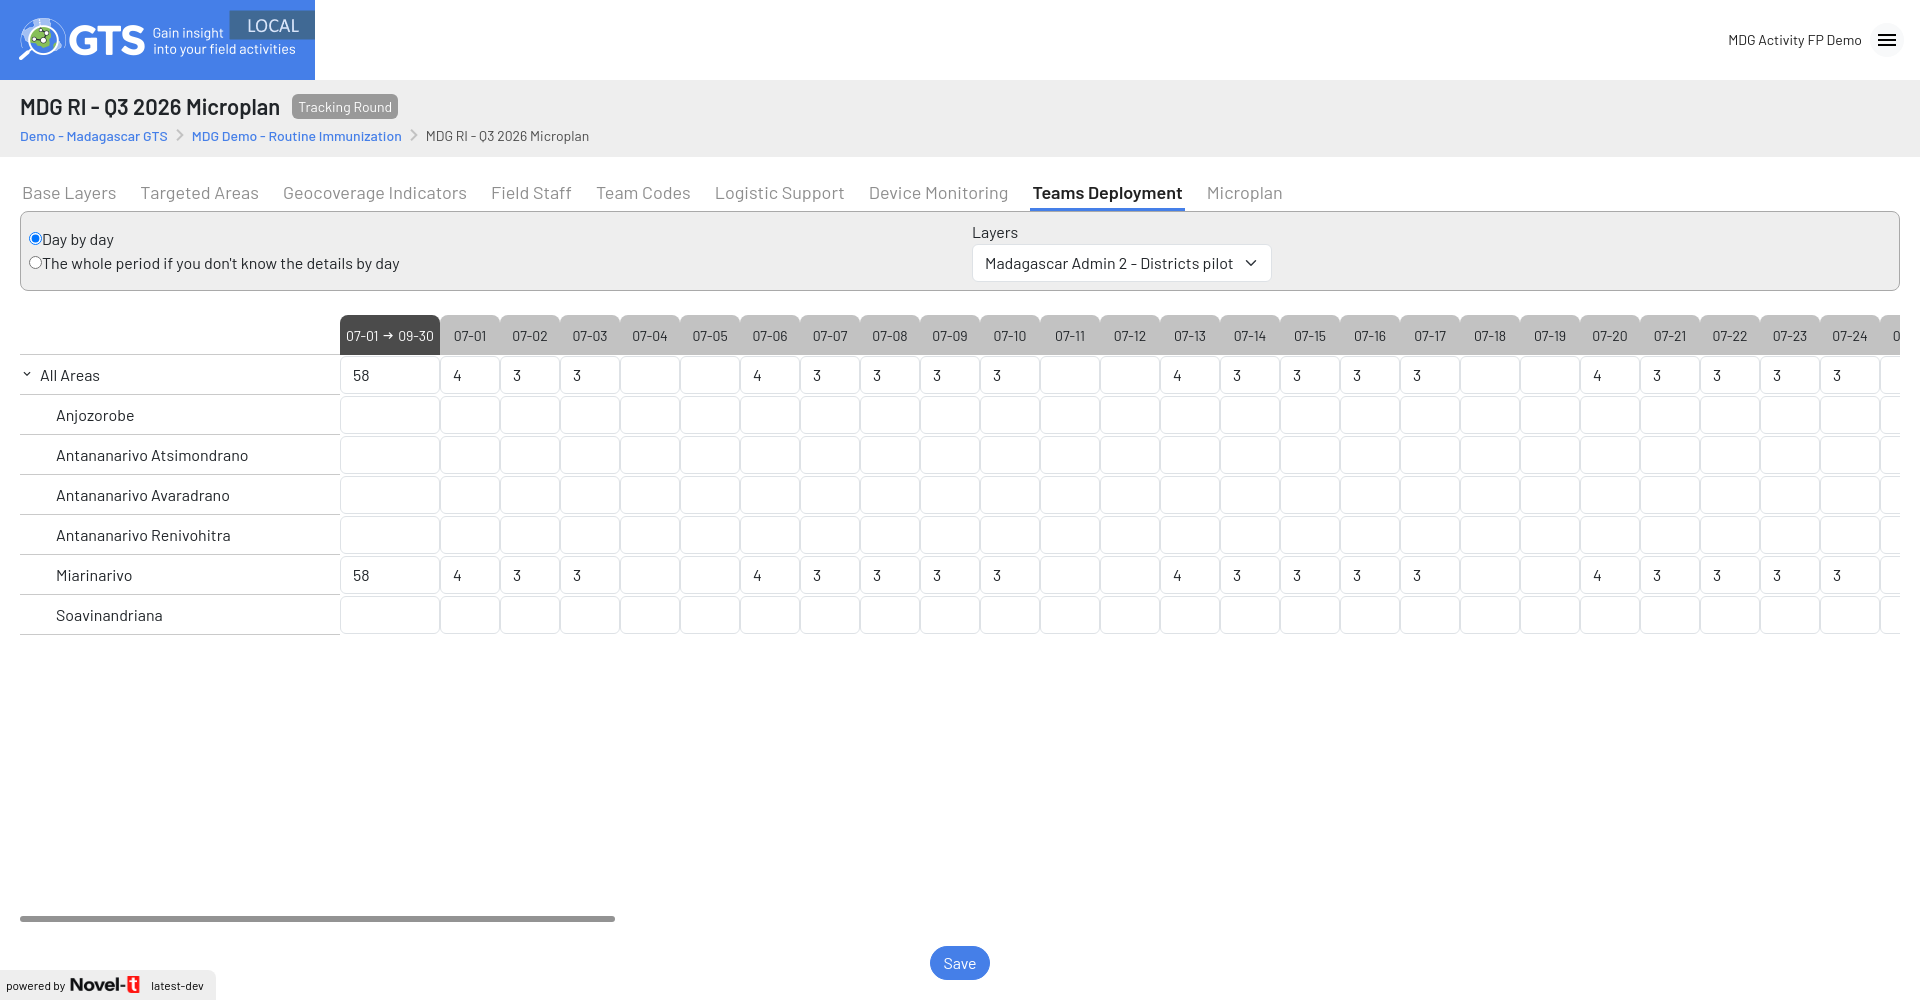
Teams Deployment of the MDG RI demo Tracking Round, entered day by day for the district: 3 teams on each working day, and a fourth team on the first working day of each week. The figure shows the first weeks of the round, which runs until 30 September
Choose Day by day when you know on which day each area will be visited, or The whole period if you don’t know the details by day. In the MDG RI demo, the 3 teams work on every weekday from 1 to 24 July, so the plan is entered day by day, for the district only because the teams cross communes during outreach and door-to-door days. When outreach sessions are spread over the month without a fixed calendar, the whole period is the realistic choice.
In Layers, choose the level at which you enter the figures (all areas, a base layer such as District, or the Targeted Areas). Totals of the larger areas are computed automatically.
Click Save.
When microplans are applied, GTS fills this table itself, for the whole period, from the number of visits planned by the HFs. Check it after application rather than entering it by hand.
In the MDG RI demo, 58 team-days are planned from 1 to 24 July and the 3 teams reported 54 of them: Teams report. shows 93% (54 / 58).
Warning
Changing the period mode or the layer asks for confirmation. Switching to Day by day or to a smaller layer removes the values entered; switching to the whole period or to a larger layer keeps only the totals. Changing the dates of the Tracking Round also removes the Teams Deployment.
4. Review the activity
Open the map of the Tracking Round. A monthly review with district supervisors typically looks at:
- Were the planned localities reached?
Geo. coverage in the header and in the Areas tab gives the share of planned localities visited, by district, commune and fokontany. Drill down to see which localities remain red (not visited).
- Were the sessions held as planned?
Teams report. compares the team-days with activity in the planned localities with the expected teams (the planned visits after microplan application). A low value in an area means that sessions were not held, or that teams did not carry or upload their phones.
- Where and when did sessions take place?
The Activity tab lists the detected sites with their number of visit days, duration and last visit, and the history of each site by day and team (see Stationary campaigns and fixed posts).
- What happened on a given day?
Switch the Period to By day to review a single day, for example to discuss a specific outreach trip with the HF.
A locality planned for several visits counts once in Geo. coverage: it is either visited or not. Whether all its planned visits took place shows in Teams report., which compares the team-days of activity with the planned visits.
Note
In the MDG demo, the validated microplans are not applied to the round yet: its Targeted Areas are still the 71,970 settlement polygons of the six pilot districts, and Geo. coverage is only 1.6% (1,183 visited), 12.6% in the Miarinarivo district where the three teams work. After application, the Targeted Areas would be the localities selected by the health facilities.
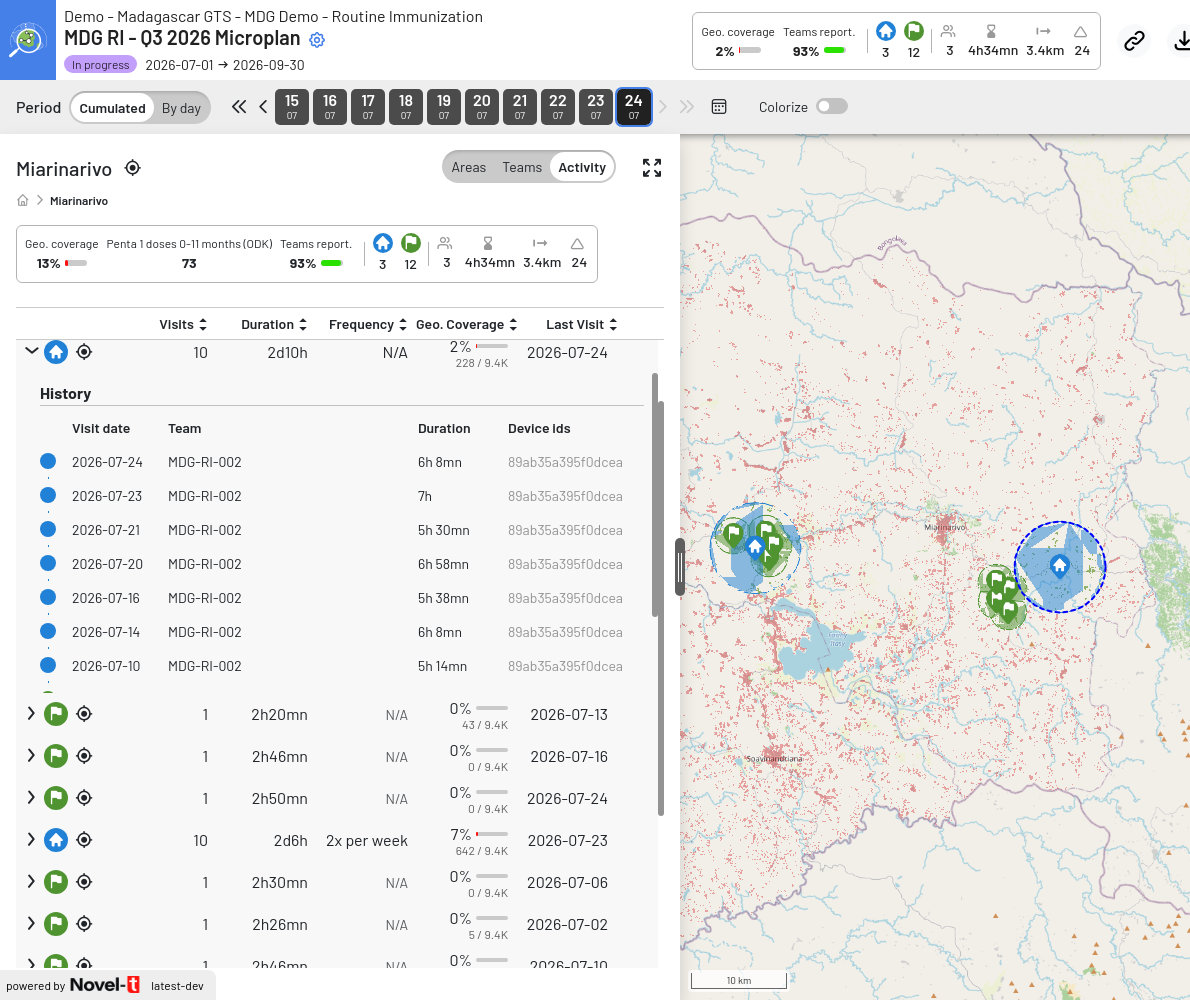
Map of the MDG RI demo round on 24 July (Cumulated), drilled down to Miarinarivo, Activity tab: the 3 Centre de santé de base sites (10 visits each) and the 12 Séance avancée sites, with the history of the first site (visit date, team, duration) and the sites on the map. Teams report. is 93%
Remember that stationary activity results are computed each night: the map shows sessions up to the previous day. Door-to-door visits are taken into account once the uploaded data has been processed (see Last computed at at the right of the period bar of the map).
5. Report
Download the Geocoverage Indicators (Excel) for the period, including the stationary activity sheets, to prepare the monthly or quarterly RI review (see Geocoverage indicators and Targeted Areas).
For a dashboard updated automatically, connect Power BI to the Open Data service.
Use the localities not reached and the sessions not held as input for the next microplan.
Service coverage objectives
When the Targeted Areas are the service locations themselves (fixed posts and outreach sites with a planned frequency of visit, imported from GMT), GTS computes a Service cov. indicator instead of Geo. coverage: the number of visits achieved compared with the number of visits expected from the planned frequency over the period. See GMT microplan import.