Map Indicators and Panels
This page explains the indicators shown on the map of a Tracking Round, how to read them, and how to use the data panel to compare areas and teams. For the map layout, see Map Overview; for the drilldown by area, see Geo-Coverage Investigation.
Where indicators are shown
Indicators appear in three places:
Header summary — the whole Tracking Round, all days included. It does not change when you select another day.
Data panel summary — the area you drilled into (or the whole round at the top level), for the period selected in the period bar (Cumulated or By day).
Data panel lists — one row per area (Areas view) or per team (Teams view), also for the selected period.
Hover a value to see the numbers behind it.
Summary indicators
The summary box shows percentages first, then small figures with icons.
Indicator |
Meaning |
|---|---|
Geo. coverage |
Targeted areas visited / targeted areas (tooltip: Number of TAs visited, Number of TAs). See Geo-Coverage Investigation. |
Service cov. |
Replaces Geo. coverage for rounds whose targeted areas are service locations (GMT microplan import, see GMT microplan import): visits achieved / visits expected (tooltip: Number of objective reached, Number of objective expected). |
Custom indicators |
Indicators configured by the Focal Point, shown with their own name (for example Population coverage or OPV doses 0-11 months (ODK)). See Custom indicators. |
Teams report. |
Team reporting compared with the deployment plan. See Teams reporting. |
Teams icon |
Unique teams: number of different teams that reported in the period. |
Hourglass icon |
Average time spent per team and per day worked: total time divided by the number of team-days (tooltip: Daily average activity for N teams., where N is the number of team-days, with Total duration accounted and Total duration). |
Distance icon |
Average distance covered per team and per day worked, calculated the same way (tooltip: Distance accounted, Number of teams, Distance total). |
Triangle icon |
Number of ODK form submissions sent from inside the targeted areas (tooltip: Accounted and Total). Only shown when forms are used. |
When the round has targeted areas, team, duration, distance and submission figures only count data inside the targeted areas (GTS calls them accounted). The tooltips also give the total, including data outside the targeted areas. This is why the Data Collection column of Tracking Round Selection (Map Wizard), which counts all submissions, can be higher than the triangle figure of the map.
Demo: for the MDG D2D - July 2026 Round, the header shows 8 unique teams, 5h38mn and 8.0km per team-day (40 team-days, time and distance inside the targeted areas) and 341 submissions.
For rounds with stationary activity detection, one coloured icon per activity type shows the number of detected activities.
Percentage colours
Percentage bars use the same colours everywhere: green above 75%, yellow above 50%, orange above 25%, red at 25% or below. Values are capped at 100%.
Teams reporting
Teams report. compares the teams that actually worked with the teams planned in the Teams Deployment of the Tracking Round. It counts team-days: each team is counted once for each day it reported.
Sum of daily teams accounted — for each day of the period, the number of teams with at least one visit to a targeted area, added together.
Sum of daily expected teams — for each day, the number of teams planned in the Teams Deployment, added together. If the deployment was entered for the whole period instead of day by day, the single number entered is used as it is: on a round of several days, a number of teams (rather than of team-days) makes the percentage too high (it is capped at 100%). Prefer Day by day.
Sum of daily teams total — same as the first figure, but counting any track, even outside the targeted areas.
Example: if 2 teams are planned on each day of a 5-day round (Day by day deployment), 10 team-days are expected. If both teams worked on 4 of the 5 days, Teams report. shows 8 / 10 = 80%.
If no Teams Deployment is configured, there is no expected value: the indicator shows the number of team-days instead of a percentage (label Sum of daily teams).
Demo: the MDG D2D - July 2026 Round has a day-by-day Teams Deployment by commune: 7 teams a day are planned in Analavory (35 team-days) and 1 to 4 teams a day in Anosibe Ifanja (12 team-days), 47 team-days in all. The 8 teams worked on each of the 5 days (40 team-days), so Teams report. shows 85% (40 / 47) for the round, 97% (34 / 35) for Analavory and 100% (12 / 12) for Anosibe Ifanja. A team that works in two communes on the same day is counted in both, which is why the commune figures add up to more than the 40 team-days of the round.
How a supervisor can use it: a value well below 100% on a given day means that some planned teams did not report. Switch to By day and open the Teams view to see which ones.
Note
Teams report. is only meaningful for the areas where the Teams Deployment was entered and for the larger areas that contain them. Below that level (in the demo, the fokontany and localities of a commune), the value is not compared with a plan for that area and should be ignored.
Custom indicators
Focal Points can add their own indicators in the Tracking Round administration, Geocoverage Indicators tab. Each indicator has a name and:
a Numerator field, taken from the attributes of the targeted areas (for example estimated population) or from the answers of an ODK form. For a targeted area attribute, GTS adds up the values of the visited targeted areas only;
an optional Denominator field, added up for all targeted areas (visited and not visited). When a denominator is set, the indicator is shown as a percentage.
In the MDG demo:
Population coverage adds up the estimated population (
est_pop) of the visited areas and divides it by the estimated population of all areas: 70% (48.0K / 68.4K). It answers “what share of the population lives in areas already visited?”.OPV doses 0-11 months (ODK) adds up the OPV doses given to children aged 0-11 months, reported in the ODK form. It has no denominator, so it shows a total: 1.3K (1,251 doses).
Tip
A population-based indicator can tell a different story from Geo. coverage. In the demo, the 67% of targeted areas visited hold 70% of the estimated population. If they held 90%, most people would have been reached and the remaining areas would be small; the opposite would point to large settlements still to visit.
When the definition of an indicator changes, the Focal Point must click Recompute in the Geocoverage Indicators tab before the new values appear on the map. Custom indicators are not available for rounds whose targeted areas are service locations (GMT microplan import).
Grouped indicators
Focal Points can also choose Group attributes in the Geocoverage Indicators tab: attributes of the targeted areas with a few distinct values, such as the target type or the settlement type. On the map, a grouping list appears next to Filter in the Areas view.
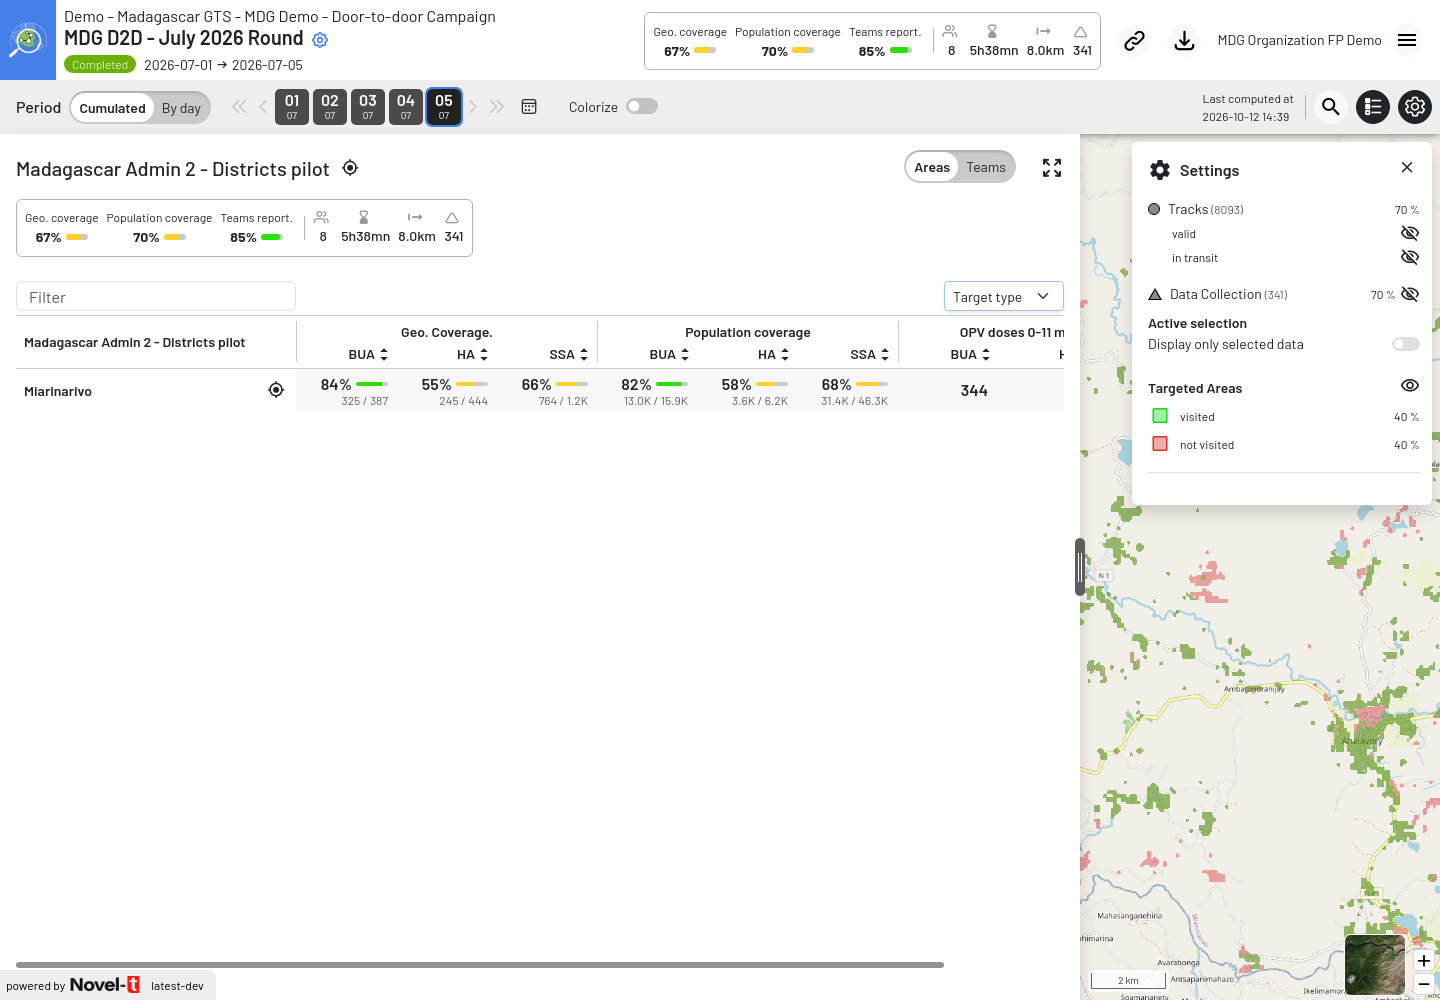
Areas view grouped by Target type: Miarinarivo reaches 84% (325 / 387) for BUA targets, 55% (245 / 444) for HA targets and 66% (764 / 1.2K) for SSA targets
To compare groups:
Open the data panel and select Areas.
In the grouping list, replace No grouping with a group attribute, for example Target type.
Each indicator column is split into one column per value of the attribute. For example, Geo. Coverage is shown separately for BUA, HA and SSA, for every area of the list. Teams Reporting is not shown while a grouping is selected, and the summary above the list is not split.
Sort a column to find the areas where one type of target is lagging behind.
Select No grouping to return to the normal view.
Teams view
Select Teams at the top of the data panel to see the teams that worked in the current area (or in the whole round at the top level). For rounds without targeted areas, the data panel only has this view.
Team list
The list (list icon) shows one row per team with: Geo. Coverage (targeted areas visited by this team), Duration and Distance (tooltips Daily duration and Daily distance), ODK Sub. (when forms are configured) and Last Track. Last Track is a clock: green when the last point of the team was recorded less than 24 hours ago (for a completed round: in its last 24 hours), orange for less than 48 hours, red otherwise; hover it to see the time (UTC). Use Filter to find a team by name and the arrows to sort.
Daily reporting
The chart icon shows team reporting by day: a bar chart of the Number of unique teams per day, then one row per team with a Total column and one column per day. Empty cells show the days a team did not report. This is the quickest way to spot a team that stopped sending data.
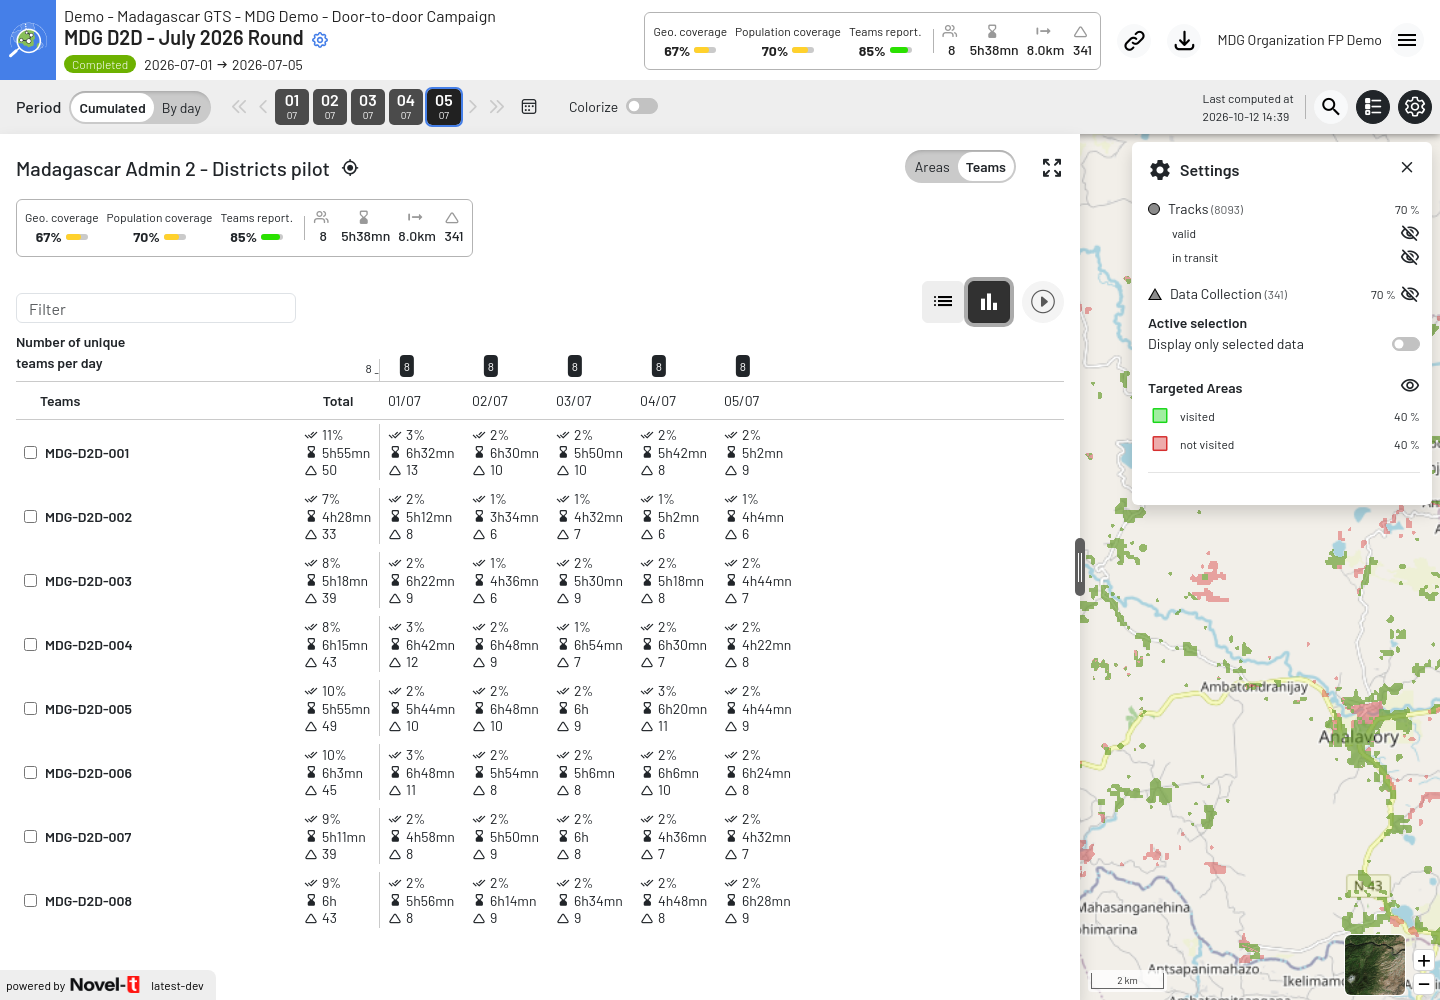
Daily reporting of the 8 teams of the MDG D2D - July 2026 Round
Follow selected teams on the map
In the Teams view, tick the box in front of one or more teams (up to 10).
Each selected team gets a colour; click the small colour dot to change it.
The tracks and submissions of the selected teams are drawn in their colour. When you select the first team and no track layer is shown, GTS shows the valid tracks and turns on Display only selected data in the Settings panel.
Use the locate icon (Zoom to) of a team to fit the map to its tracks.
Untick the teams to return to the normal view.
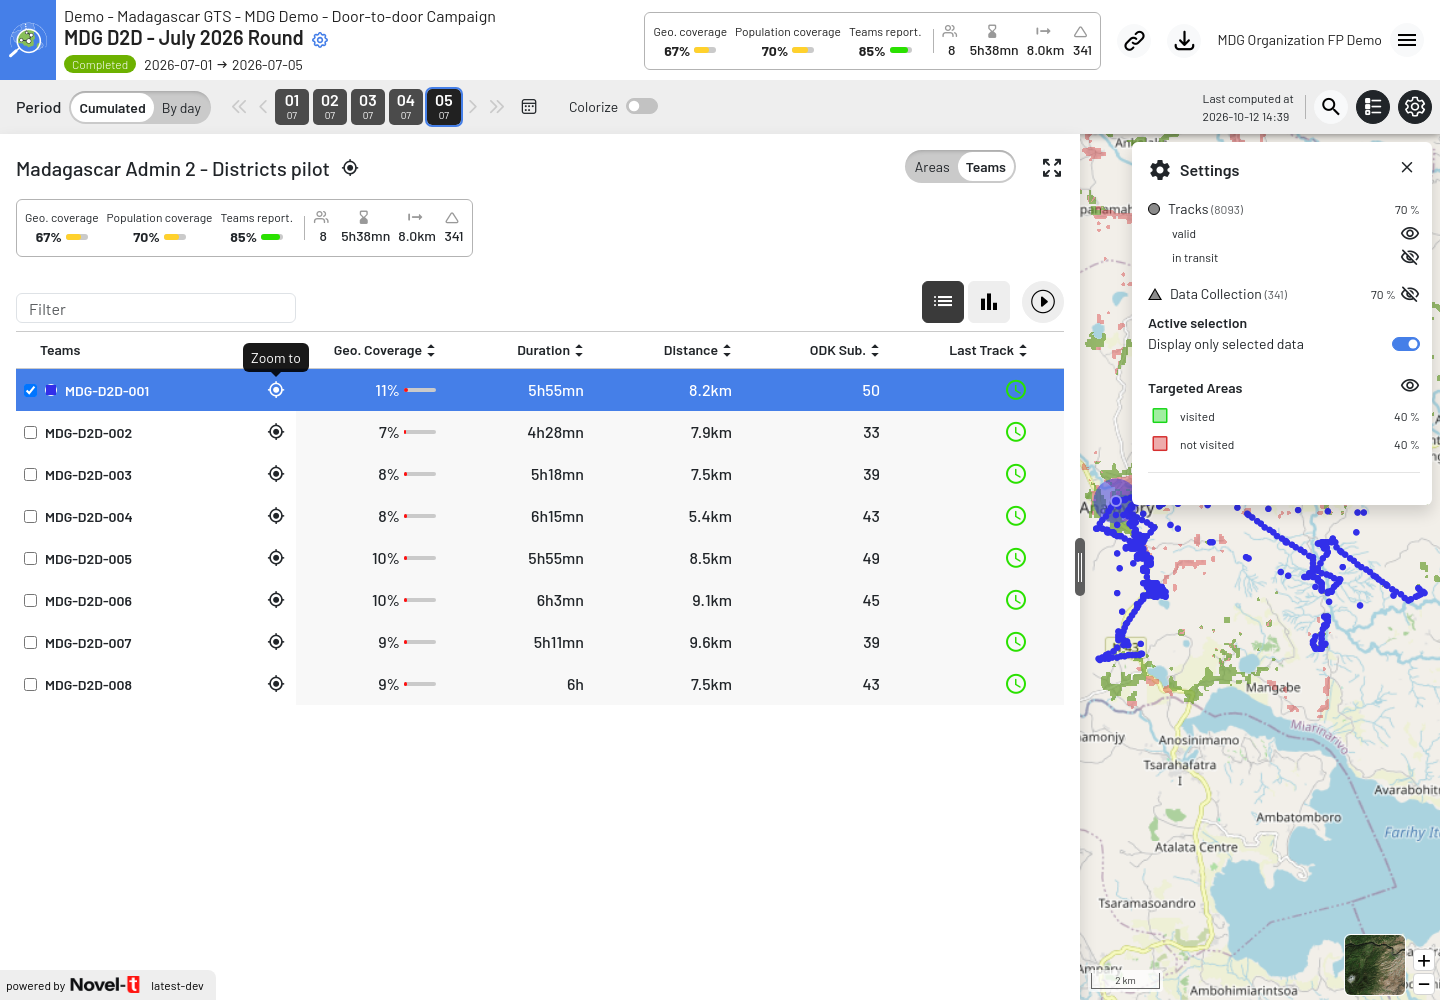
Teams view with one team selected: its tracks are drawn in its colour
Replay the tracks of a team
The replay draws the GPS points of one team one after the other, so you can see the order in which the team moved during the day.
Click By day in the period bar and select the day to replay. In Cumulated mode, the replay starts on the first day of the round and runs up to the selected day.
In the Teams view, tick exactly one team.
Click the play button next to the list and chart icons (Select only one team to play tracks). The other tracks are hidden and a player appears at the bottom of the map.
Use the player: restart, pause or resume, the speed (from x0.25 to x4), and the three-dot menu to keep the whole route in view (Fit to extent, default) or to follow the last point (Follow last track). The time of the current point is shown in UTC.
Click the arrow to minimise the player, or the cross to close it and show the other tracks again.
Changing the period or the selected team closes the player. If the team has no tracks for the period, GTS shows No tracks to play for this team and these dates….
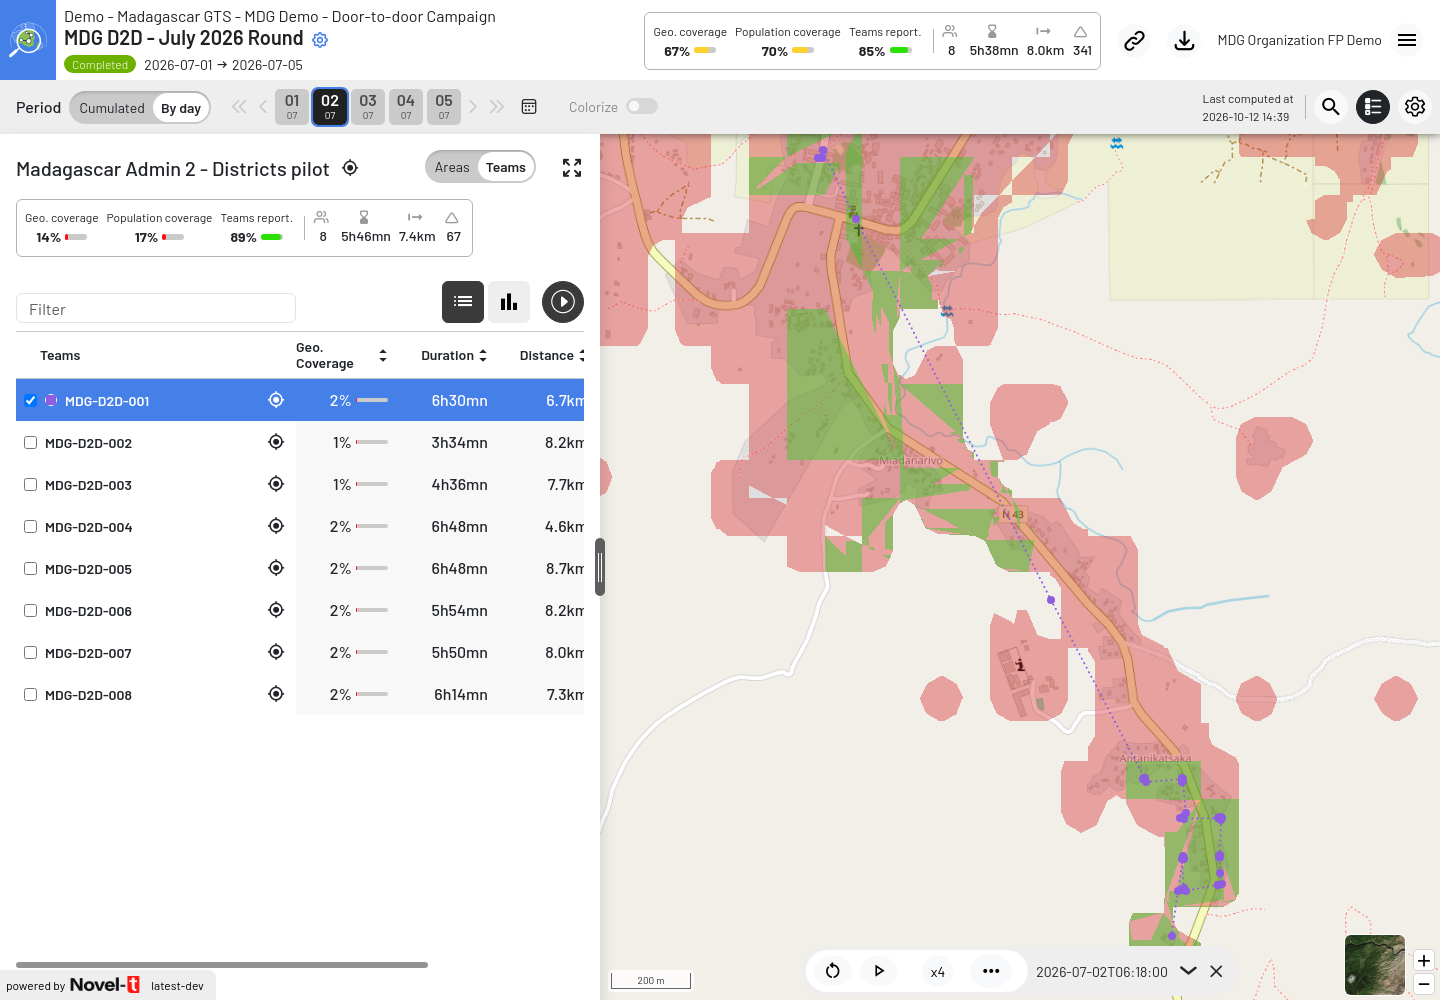
Replay of team MDG-D2D-001 on 2 July (By day), paused, with the player at the bottom of the map
Activity view
Some rounds have a third view, Activity:
For rounds with stationary activity detection (for example the stationary campaign or Routine Immunization), it lists the detected sites with Visits, Duration, Frequency, Geo. Coverage and Last Visit (see Stationary campaigns and fixed posts).
For rounds whose targeted areas are service locations (GMT microplan import), it lists the planned sites with Service cov., Visits and Objective (see GMT microplan import).
Expand a site (arrow in front of its name) to see its visit History (visit date, team and duration).
See also Routine Immunization monitoring for the end-to-end routine immunization workflow and Auto Microplanning (Administrators) for how microplans are prepared.