The GTS dashboard includes the capacity to perform geo-coverage analysis across aggregation layers, when targeted areas have been configured at the tracking round level.
Note
By default the map will automatically open in Geo-Coverage Investigation when Targeted Areas have been assigned.
Methods for changing from the mode to the regular map view or vice versa are described below.
Click on the geo-coverage control next to the tracking round name, to enter the Geographic Coverage Investigation mode.
Geo-coverage icon
Note
If the icon next to the targeted areas visited display is missing, check with the Organization or Field Activity focal points, to ensure that
aggregation base layers and targeted areas have been configured for the tracking round.
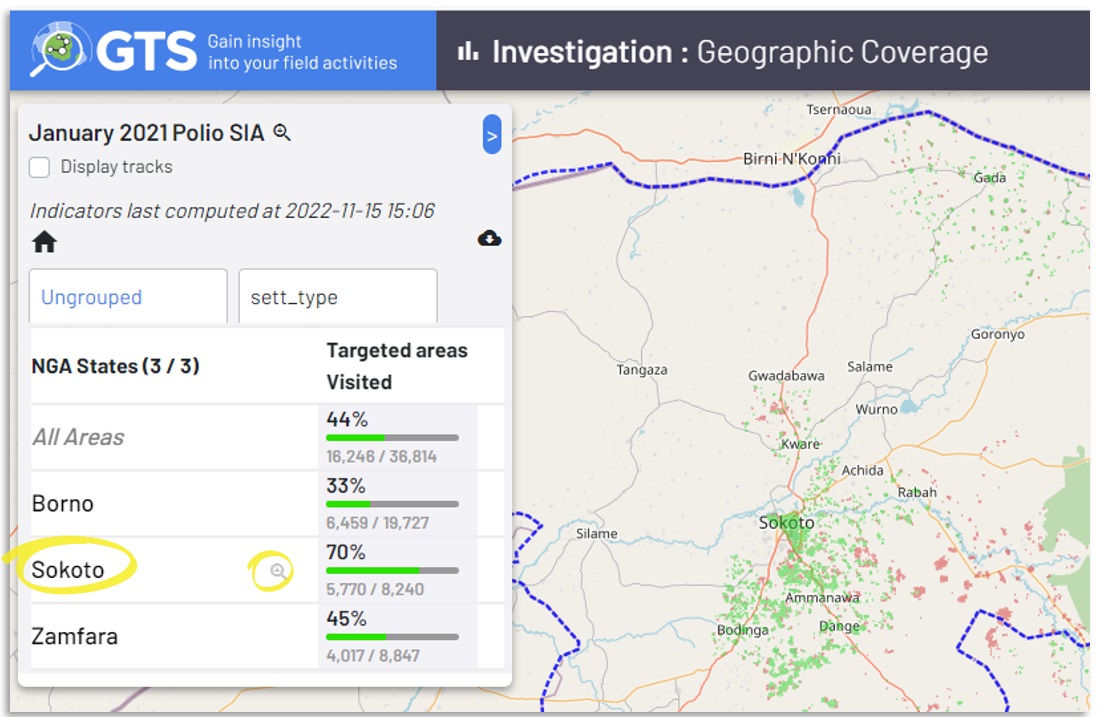
Upon entering the Geographic Coverage Investigation mode, the banner at the top of the GTS screen will change appearance to indicate that the mode is active.
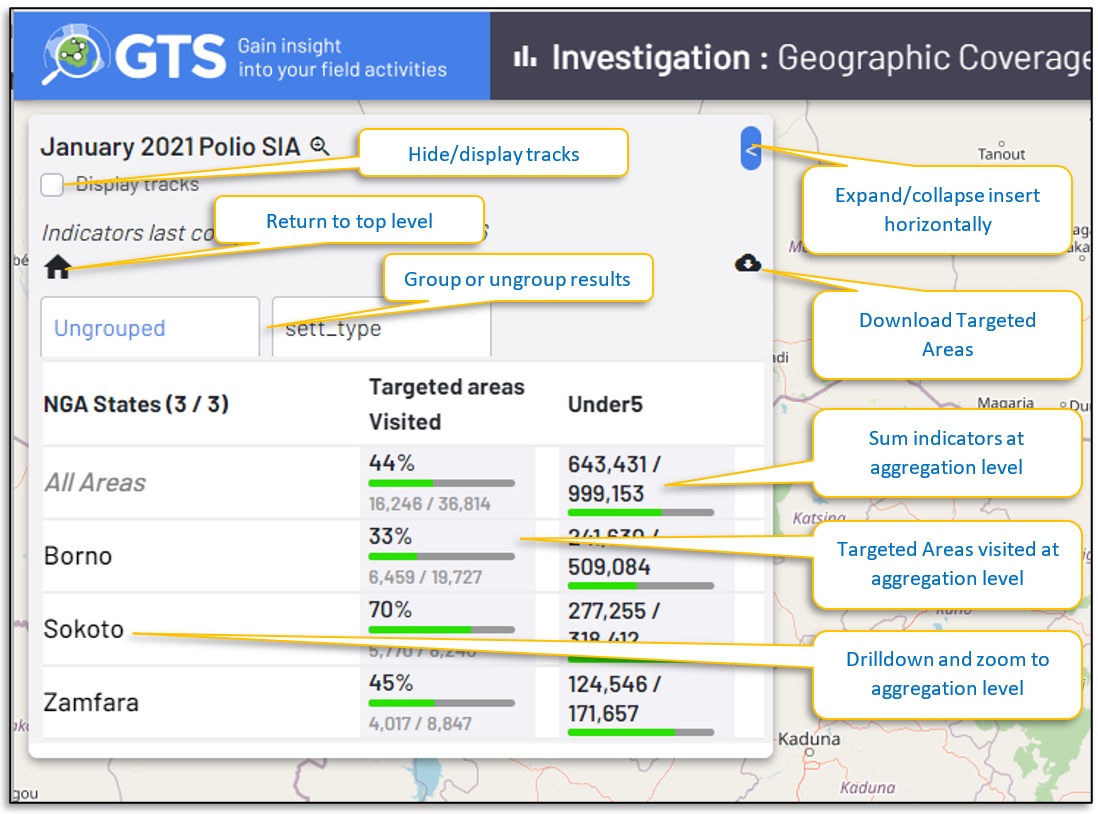
GTS Overview for the Geographic Coverage Investigation mode
The map inset of the Geographic Coverage Investigation mode enables users to analyse geo-coverage across aggregated base layers, to sum and report indicators
across aggregation levels, and to group results across pre-configured grouping criteria.
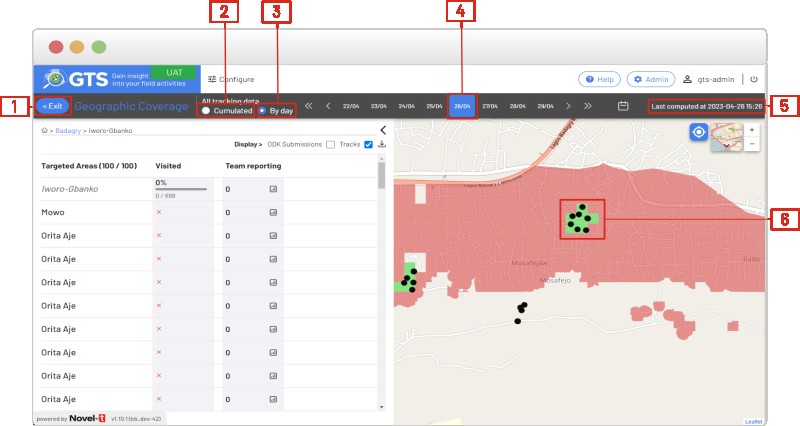
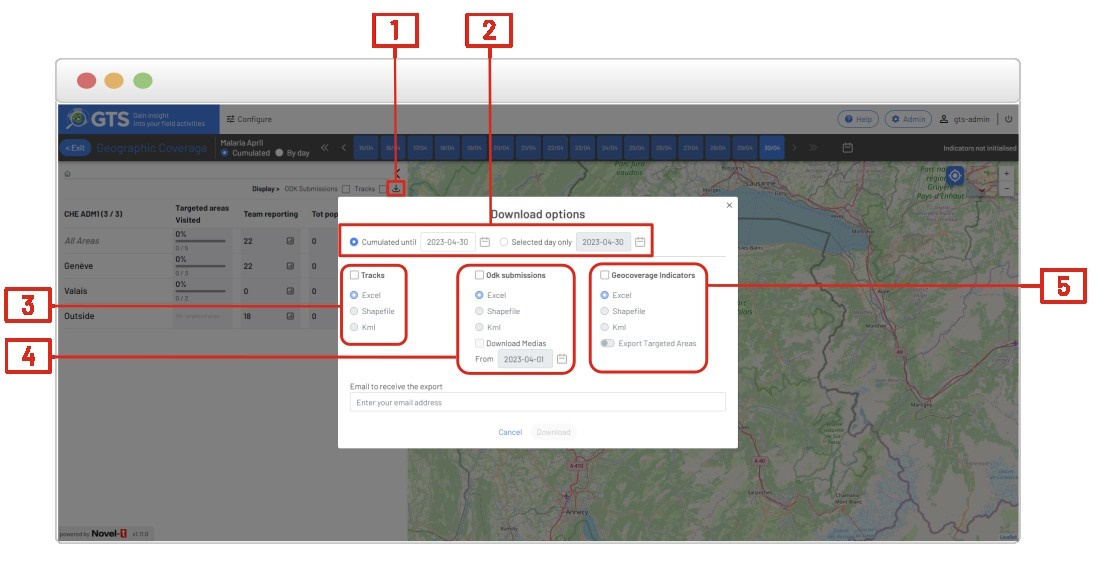
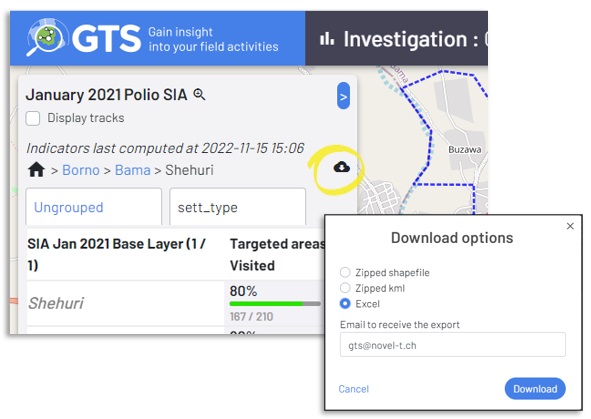
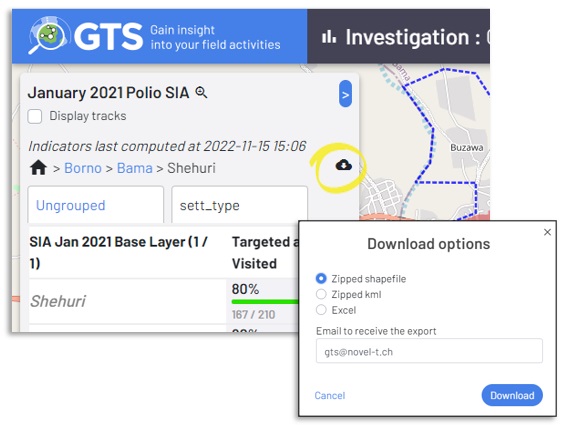
Click on the download control (point**1** in the figure below) to the right of the drilldown breadcrumb trail to open the download options popup form, from with the form select the data
format desired MS Excel, ESRI Shapefile format, or Keyhole Markup Language (kml) used with Google Earth.
The downloaded files will be filtered to include only those items at the drill down aggregation level, in the example below only items belonging to the third
deepest aggregation level will be included in the download.
Tip
Consider drilling down first, if the download of only a subsection of targeted areas for a tracking round is required. Drilling down to the required level before
downloading may result in substantially quicker download times and the use of less bandwidth.
When downloading targeted areas in MS Excel workbook format, each base-layer assigned to the targeted areas and the targeted areas appear on separate worksheets within the
Excel workbook.
The option to include Targeted Areas or not is included because downloading targeted areas may potentially require much bandwidth and could take considerable time.
The number of fields that appear in the Targeted Areas worksheet, if “Export Targeted Areas” is selected, depends on the number of base layers attributed to the Targeted
Areas for aggregation, as well as the number of sum indicators assigned if any.
The table below depicts the fields that would appear in the targeted areas worksheet if three base layers and one sum indicator are attributed to the targeted areas layer.
Name of the Organisation containing the field activity (assigned by GTS).
Field Activity
Name of the field activity (assigned by Organisation Focal Point).
Tracking Round
Name of the Tracking Round (assigned by Organisation/Field Activity Focal Point).
BL3 ID
ID of the Base Layer (assigned by GTS).
BL3 Label
Label of the Base Layer (assigned by Organisation/Field Activity Focal Point).
BL2 ID
ID of the Base Layer (assigned by GTS).
BL2 Label
Label of the Base Layer (assigned by Organisation/Field Activity Focal Point).
BL1 ID
ID of the Base Layer bottom most base layer- contained by other other base layers (assigned by GTS).
BL1 Label
Label of the Base Layer (assigned by Organisation/Field Activity Focal Point).
Targeted Area ID
ID of the Targeted Areas set by the GTS system
Targeted Area Label
Label of the Targeted Areas (assigned by Organisation/Field Activity Focal Point).
Visited
True/False whether the targeted area is considered visited based upon accountability rules
Sum Indicator
Sum Indicator of the targeted area such as population there may be more than one sum inidcator
X
Longitude of the centroid of the Targeted Area polygon
Y
Latitude of the centroid of the Targeted Area polygon
The table below depicts the fields that would appear in the base layers worksheet for the highest level of aggregation if three base layers and one sum indicator for
population are attributed to the targeted areas layer.
Base Layers worksheet fields for highest level base layer
Data field name
description
BL3 ID
ID of the Base Layer (assigned by GTS).
BL3 Label
Label of the Base Layer (assigned by Organisation/Field Activity Focal Point).
# Visited
Number of targeted areas visited in the base layer
# Targeted Areas
Number of targeted areas in the base layer
Percentage
Percentage of targeted areas in the base that that were visited
X
Longitude of the centroid of the Targeted Area polygon
Y
Latitude of the centroid of the Targeted Area polygon
Population visited
Estimated population visited in the base layer
Population total
Estimtaed population of the base layer
Population percentage
Percentage of estimiated populationin the base that that were visited
Subsequent base layer worksheets will add fields for their own base layer ID and Label and will adjust other data to represent detail at that level. The table below depicts
the fields that would appear in the base layers worksheet for the second-highest level of aggregation if three base layers and one sum indicator for population are attributed
to the targeted areas layer.
Base Layers worksheet fields for next highest level base layer
Data field name
description
BL3 ID
ID of the Base Layer (assigned by GTS).
BL3 Label
Label of the Base Layer (assigned by Organisation/Field Activity Focal Point).
BL2 ID
ID of the Base Layer (assigned by GTS).
BL2 Label
Label of the Base Layer (assigned by Organisation/Field Activity Focal Point).
# Visited
Number of targeted areas visited in the base layer
# Targeted Areas
Number of targeted areas in the base layer
Percentage
Percentage of targeted areas in the base that that were visited
X
Longitude of the centroid of the Targeted Area polygon
Y
Latitude of the centroid of the Targeted Area polygon
Population visited
Estimated population visited in the base layer
Population total
Estimtaed population of the base layer
Population percentage
Percentage of estimiated populationin the base that that were visited
The number of fields and records will increase with each subsequent aggregated base layer, ending with the targeted areas layer as the lowest aggregation level.
Select “Zipped shapefile” to download a .zip archive of the ESRI shapefile components of the Targeted Areas that may be opened in a GIS application such as ArcMap or QGIS.
The Shapefile download contains the same data fields as those included in Targeted Areas worksheet of the Excel download.
Caution
A warning message appears when “Zipped shapefile” is selected if “Export TA in Excel (by default)” is not selected by the administrator when configuring the targeted
areas. This message is to remind users that although the Excel download may have a smaller size by omitting the Tarageted Areas worksheet, this is not the case for
ESRI shape file format downloads and they may take considerable time depending on the number of tarageted areas included in the layer.
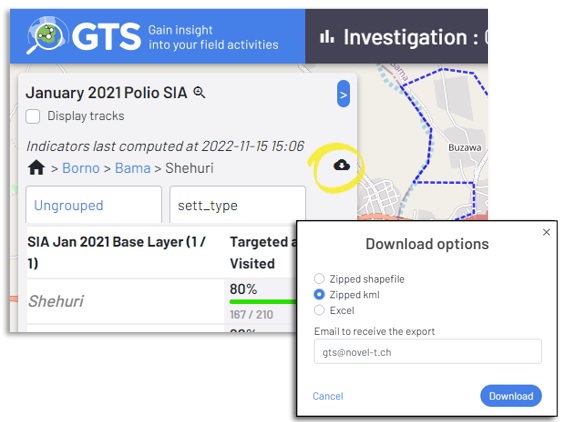
The Shapefile download contains the same data fields as those included in Targeted Areas worksheet of the Excel download.
Caution
A warning message appears when “kml” is selected if “Export TA in Excel (by default)” is not selected by the administrator when configuring the targeted
areas. This message is to remind users that although the Excel download may have a smaller size by omitting the Tarageted Areas worksheet, this is not the
case for kml format downloads and they may take considerable time depending on the number of tarageted areas included in the layer.
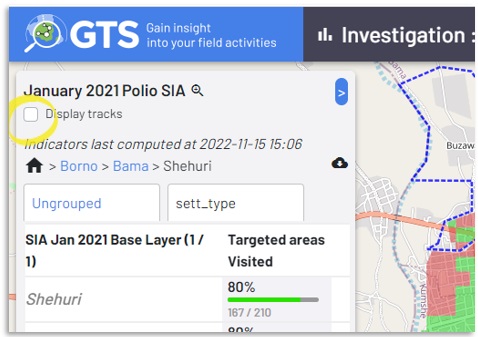
To improve display performance tracks are by default not displayed on the Geo-Coverage Investigation map, to male the tracking point appear on the map,
check the “Display tacks” box found at the left of the inset panel just below the tracking round name.
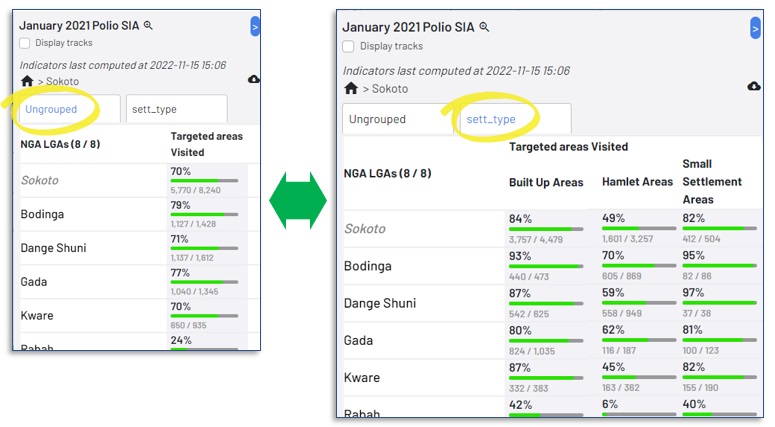
The GTS provides for grouping of targeted area polygons to enhance analysis. Grouped indicators are qualitative attributes configured by
the organizational or field activity focal points when uploading the targeted areas layer to the GTS. Grouping indicators are defined by
attribute fields in the targeted areas data set groups based on values in those fields.
In the example below, one attribute in the targeted areas dataset labelled “sett_type” has been designated as the grouped indicator and the values for this
attribute may be either “Built Up Areas”, Small Settlement Areas” or “Hamlet Areas”.
Select the tabs for ‘Ungrouped’ or the name of the group assigned, the GTS Geo-Coverage Investigation mode can handle multiple grouping attributes
individually across multiple grouping tabs.
The GTS provides for adding quantitative values to each targeted area, and can sum or average indicator values at each aggregation level.
Click on the control located in the upper right corner of the inset to horizontally collapse the inset to display only
Targeted Areas and hide quantatative attributes such as population rendering a greater portion of the map visible, click on the
same control to expand the inset to its original size.
Using quantitative values may provide more meaningful analysis than the number of targeted areas visited. In the example below,
each targeted area has been attributed a value for estimated under 5 years of age population “Under5”. In the example while
only 70% of targeted areas may have been visited in a particular state, these targeted areas compromise 87% of the estimated
Under5 Population, this information may be of greater value in certain circumstances such as vaccination campaigns .
Control to collapse or expand the Geographic Coverage Investigation inset.
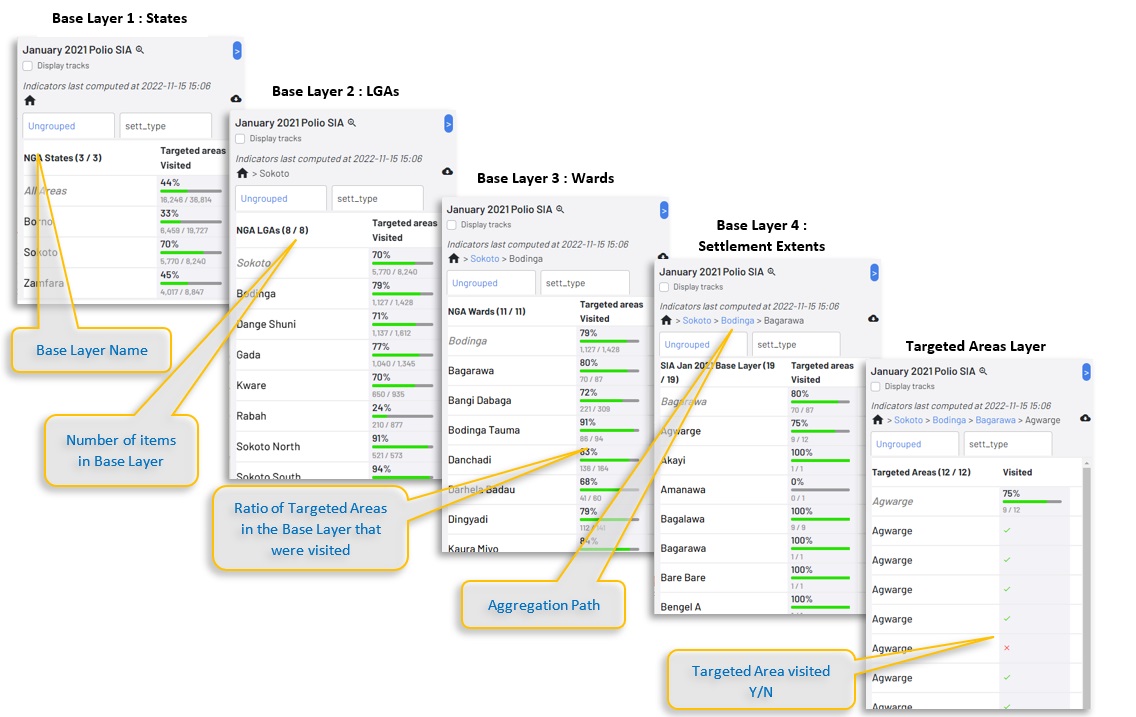
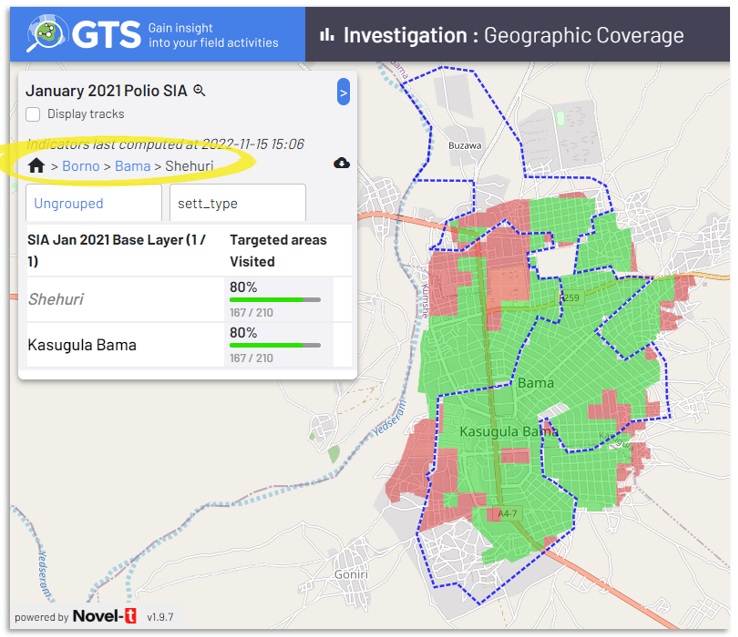
The GTS Geo-Coverage Investigation mode features analysis at levels aggregation across nested base layers such as administrative boundaries
to which targeted areas are attributed.
To investigate a base layer for deeper analysis, hover the mouse cursor over the base layer name. The name
will change colour to blue to indicate that it is a link and a magnifying glass icon will appear to
the right of the name.
Click on the base layer name to drill down or click on the magnifying glass icon to zoom the map to the
layer delineated the with a blue dashed line (click the magnifying glass icon again to remove the dashed line
delimitation).
Clicking on base layer item names drill the analysis deeper to more details levels, with the lowest level being
the Targeted Areas. To return to a higher level click on its name in the path (current level designated with a dashed
blue underline higher levels appear in blue as clickable links)
 next to the tracking round name, to enter the Geographic Coverage Investigation mode.
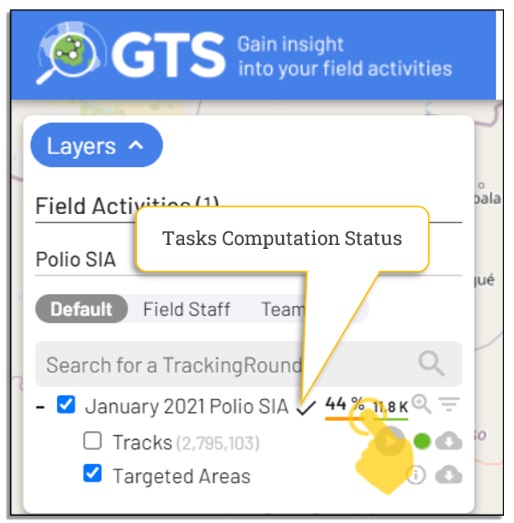
control to return to the highest level at any time will performing analysis.
 control located in the upper right corner of the inset to horizontally collapse the inset to display only
Targeted Areas and hide quantatative attributes such as population rendering a greater portion of the map visible, click on the
same control to expand the inset to its original size.
control located in the upper right corner of the inset to horizontally collapse the inset to display only
Targeted Areas and hide quantatative attributes such as population rendering a greater portion of the map visible, click on the
same control to expand the inset to its original size.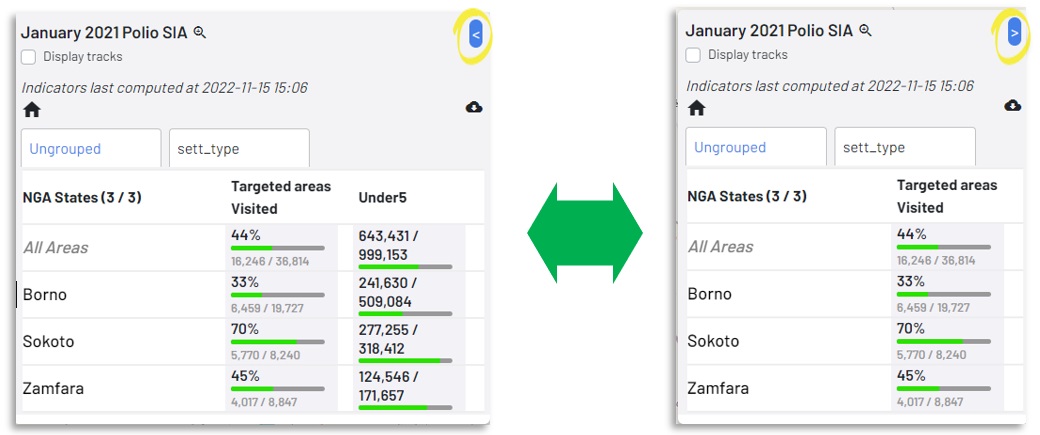
 will appear to
the right of the name.
will appear to
the right of the name.