Map View
Clicking on the View on Map button in the Configuration Settings, after having selected the tracking round(s) to display, will open the display screen that shows location of Tracks, ODK forms and Targeted Areas on the map.
Locate, Base Maps, and Zoom
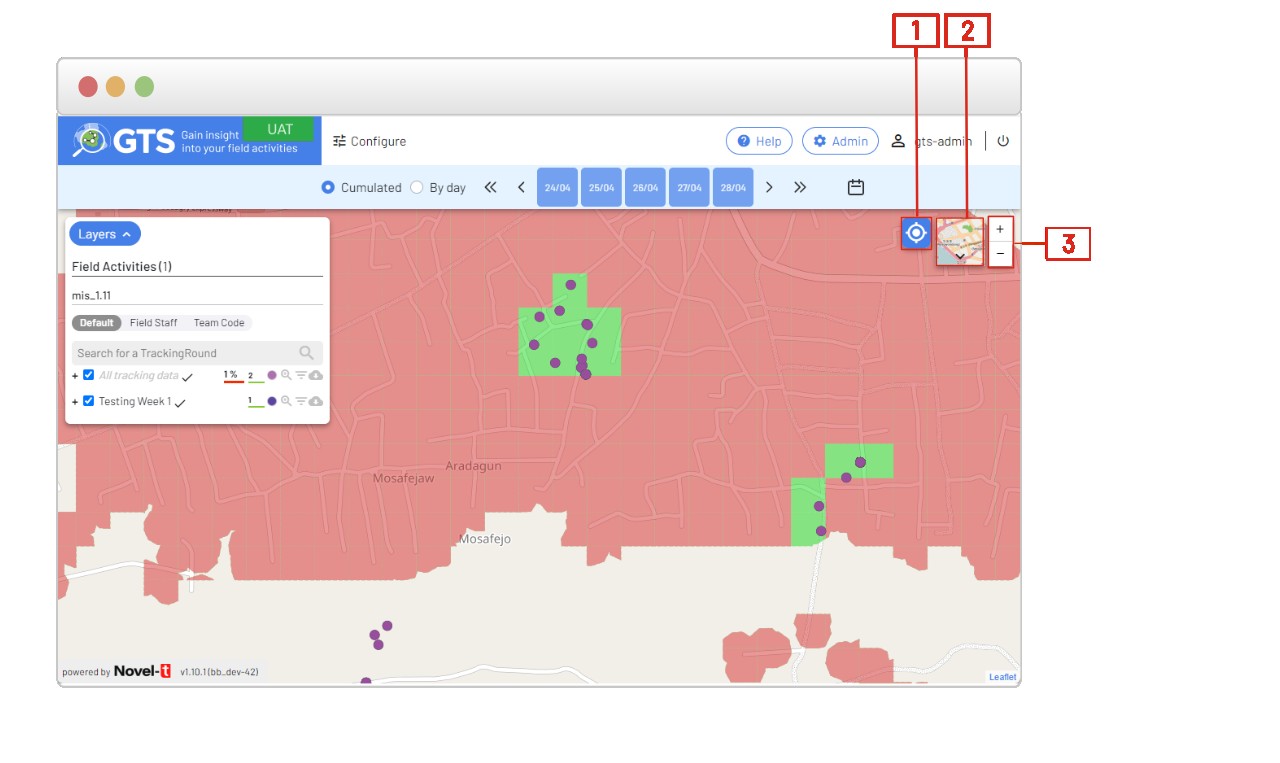
The upper left corner of the map display presents controls for finding locations by name, selection base maps, and zooming the map display.
Finding a location by name
Click on the Name Search Button  (point 1 in the screenshot below) and enter at least three characters to find and zoom to a either Base Layer item, targeted area or OSM POI.
Search By Name display control
Click on the basemap (point 2 inthe above screenshot) control to toggle between the street map and satellite imagery base maps.
Click on the + or - buttons (point 3 in the above screenshot) to zoom in or out, zooming is also possible using your PC’s mouse.
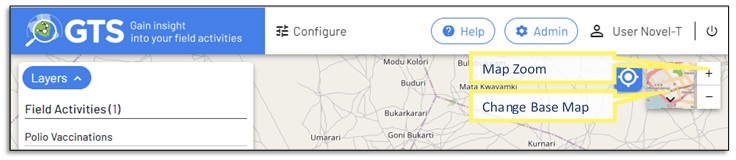
Basemap and Zoom controls
Symbology
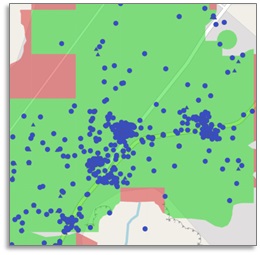
Tracks are designated on the map by coloured dots, the colour of the symbol is assigned by the GTS system and can be edited by organization administrators by editing tracking round details in the GTS administration Console.
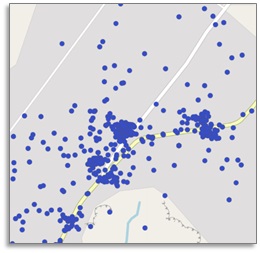
Depiction of Tracks
ODK forms are designated on the map by coloured triangles, the location on the map is based upon the geo-tag of the form.
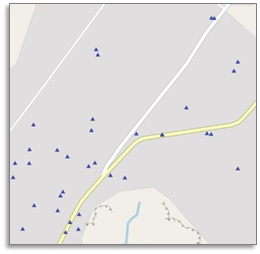
Depiction of ODK forms
Targeted areas are designated by green or red polygons, green indicates that the area has been visited per the established rules.
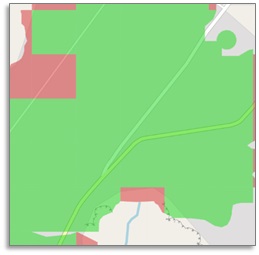
Depiction targeted areas
Symbology layers may be combined by selecting them in the inset to the left of the screen.
Combined Symbology
Clicking on a Track, ODK or Targeted Area symbol will open a popup form with details of the item and the possibility to download details and media attachments in the case of ODK form.
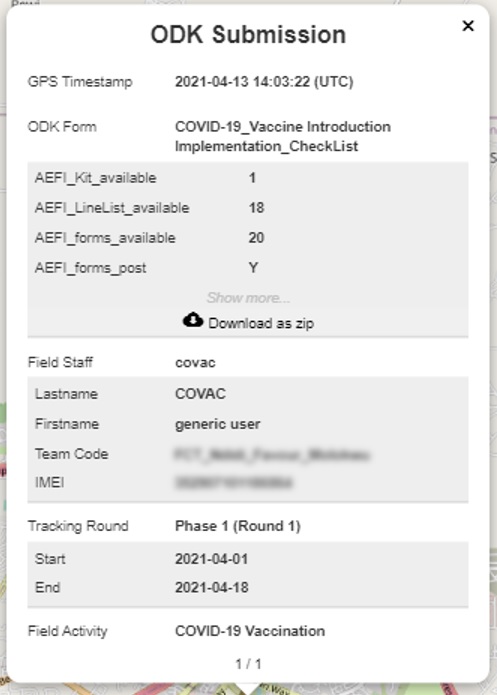
Symbology Popup Form
Filter by dates
The filter bar at the top gives you the ability to filter tracks and ODK submissions displayed on the map. You can decide to display data for a specific date or cumulated data for a specific date range (point 1 of the following screenshot). The date(s) can be selected from the pagination (see point 2). if your date range is quite wide, you have to possibility to use the date picker (see point 3)
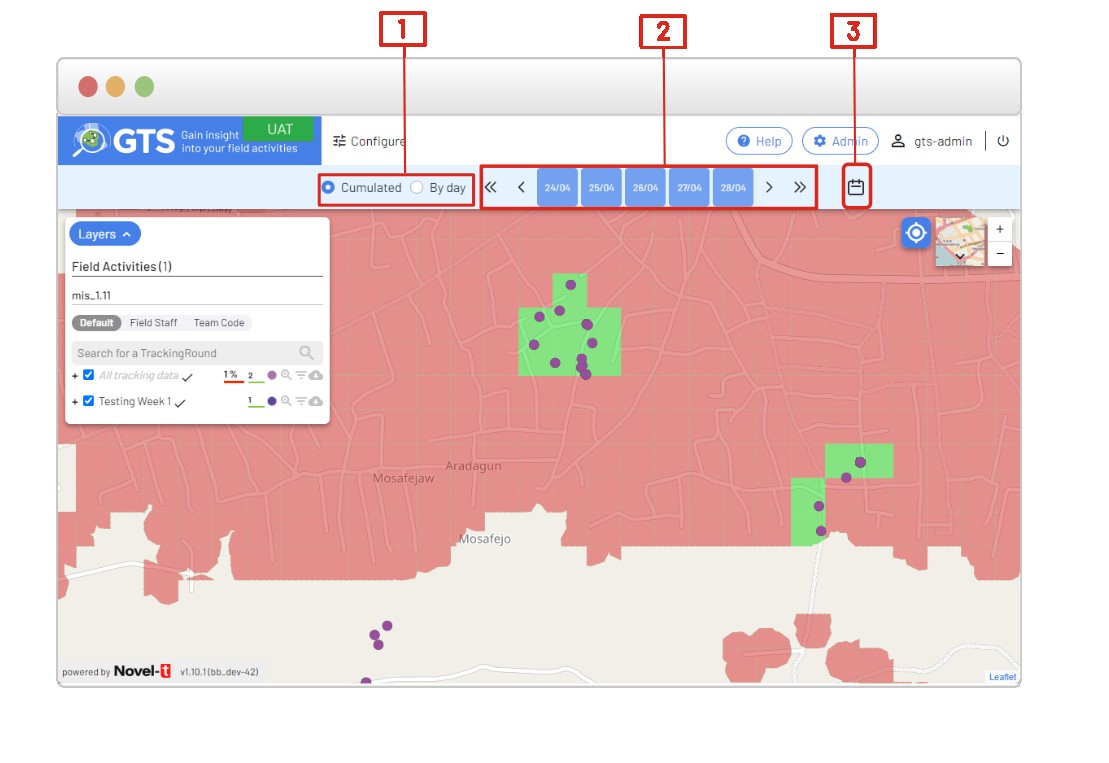
Filter bar
Layers Inset
The Layers inset is a rich source of information about the displayed Tracks, ODK forms and Targeted Areas. The inset also contains various controls to hide/display symbols, zoom to the extent of the Tracking Round, filter items, and download items in various formats.
The Layers inset is grouped by Field Activity, if more than one field activity is present.
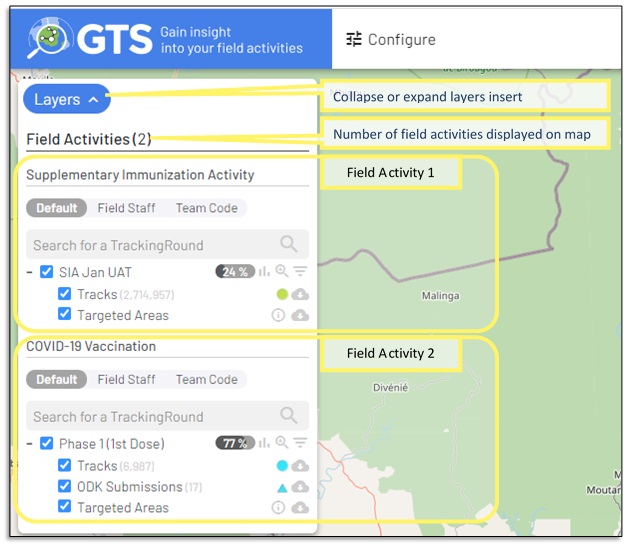
Layers Inset depiction Field Activities
The field Activity groups are broken down by selected Tracking Rounds.
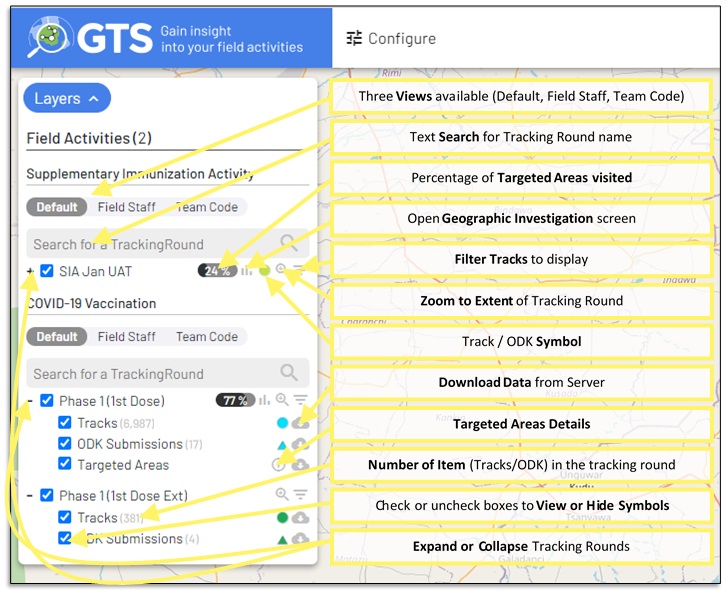
Layers inset depicting Tracking Round details
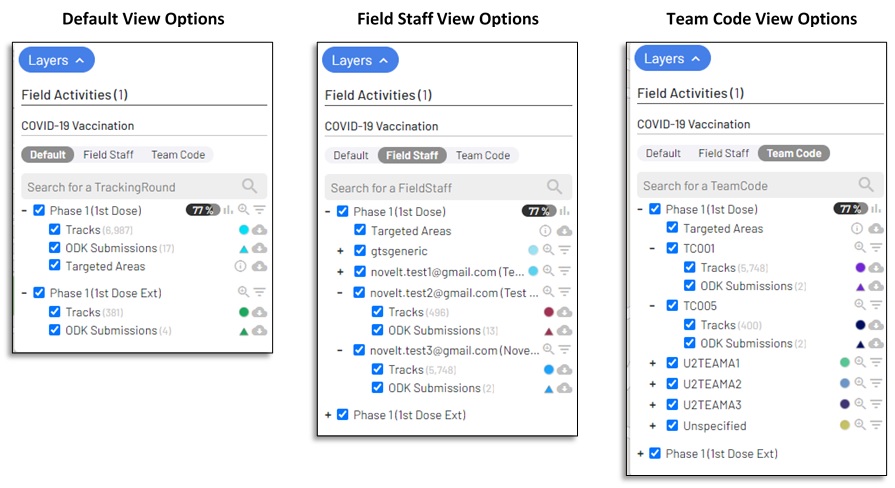
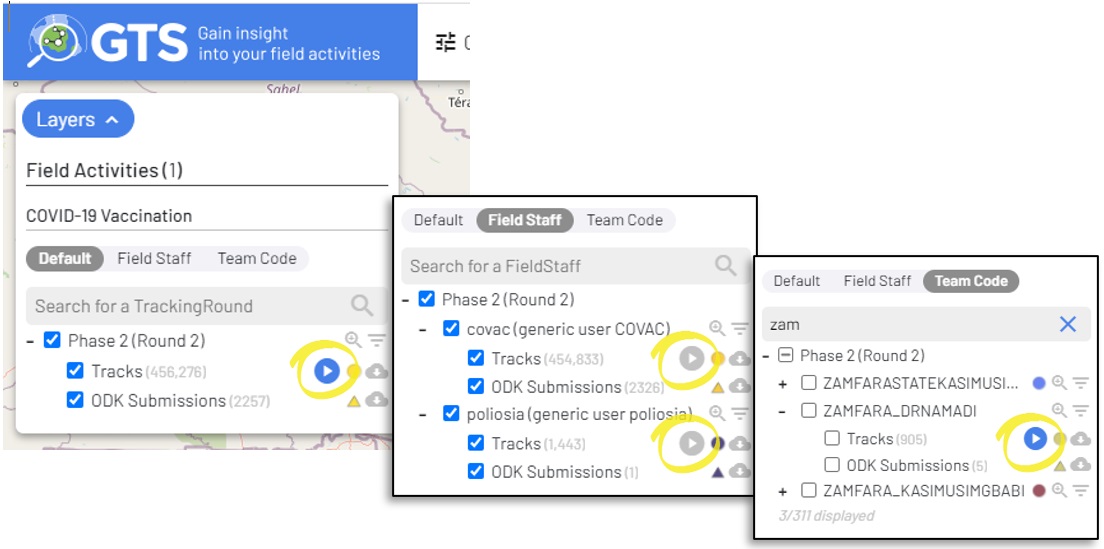
Views:
There are three views available:
Default: The Default view provides controls for the tracks and any ODK form or Trageted Areas that might have been submitted or defined for the Tracking Round.
Field Staff: The Field Staff view divides the Tracks and ODK forms details across Field Staff logins reporting for the Tracking Round and assigns specific symbol colours.
Team Code: The Team Code view divides the Tracks and ODK forms details across Team Codes reporting for the Tracking Round and assigns specific symbol colours.
Play Tracks:
The GTS dashboard includes the functionality to display an animation of the sequence in which tracks were collected by the mobile application. The Play Tracks mode allows you to replay how tracks where collected on the field.
To view the play back of tracking click on the play button  next to the Tracks item in either of the Default, Field
Staff or Team Code tabs in the GTS Map Layers insert.
next to the Tracks item in either of the Default, Field
Staff or Team Code tabs in the GTS Map Layers insert.
For more details on the Play Tracks feature see the Play Tracks section in under Geo-Coverage Investigation
Targeted Areas Visited and Teams Reporting:
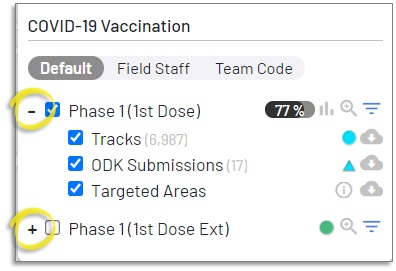
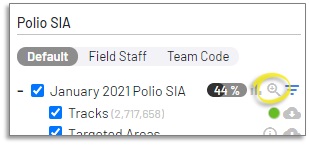
For each tracking round that has Targeted Areas assigned, an indicator of the percentage of the Targeted Areas visited will appear to the right of the Tracking Round Name. Hover over the indicator to see the number of visited and total Targeted areas.
Next to the Targeted Areas indicator is an indicator for the number of Teams Reporting which will appear if the tracking round uses Team Codes
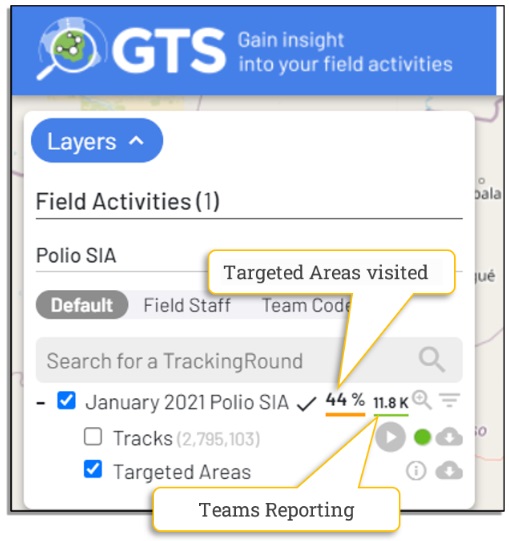
Targeted areas visited and teams reporting
Geographic Investigation:
Click on either the Targeted Areas or the Teams Reporting indicator to open the Geographic Coverage Investigation screen. Geo-coverage is explained in detail in this section of the user guide. To the left of these indicators the computation status of tasks is displayed, a checkmark denotes that indicators, metadata and visitation status of targeted areas are up to date, if computation is outstanding circular arrows will be displayed.
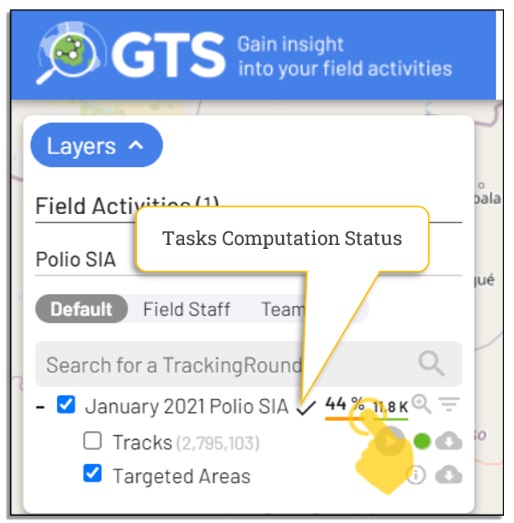
Geo-coverage icon
Filter Tracks:
Click in the  icon furthest right of the icons beside the Tracking Round Name to open the Filter Tracks popup form.
Opacity: Move the slider to change the opacity of the tracks symbols 0 is transparent 100 is opaque.
Dates: Select the date range of the tracks to display.
Status: Select whether to include Valid or Not-Valid Tracks or both. Validity of tracks is determined by the accountability rules, concerning working hours and speed, that are set for the Field Activity
Speed: Select the speed range at which the device was moving, as determined by the GPS signal, of the tracks to display.
Hours: Select the collection time range of the tracks to display.
IMEI: Filter by unique ID (International Mobile Equipment Identity), to display tracks from particular phone(s)
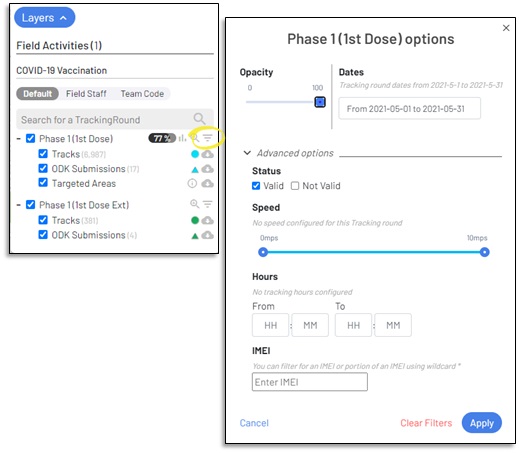
Tracks symbol filter popup form
Zoom to Extent:
Click in the  icon to the right of the icons beside the Tracking Round Name to have the map display zoom to the extent of the tracks in that tracking round.
Control to zoom map diaplay
Symbol:
The symbology used to identify tracks and ODK forms on the map is designated to the right of the item, tracks are in coloured dots and ODK forms in triangles of the same colour. The colour of the tracks symbols may be edited at the Tracking Round level.
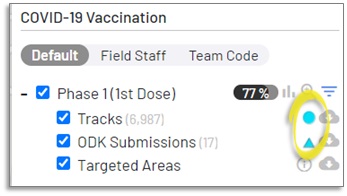
Symbology legend
Downloading Data:
Click in the download icon (point 1 in the screenshot below) to open the global export feature.
This feature allows you to download tracks (point 3), ODK submissions (point 4) and Geo-coverage indicators (point 5) in various format:
ESRI shapefile
Keyhole Markup Language (KML)
MS Excel Workbook
You also have to possiblity to chage the expected date(s) from the date selector a the top of the modal windows (see point 2).
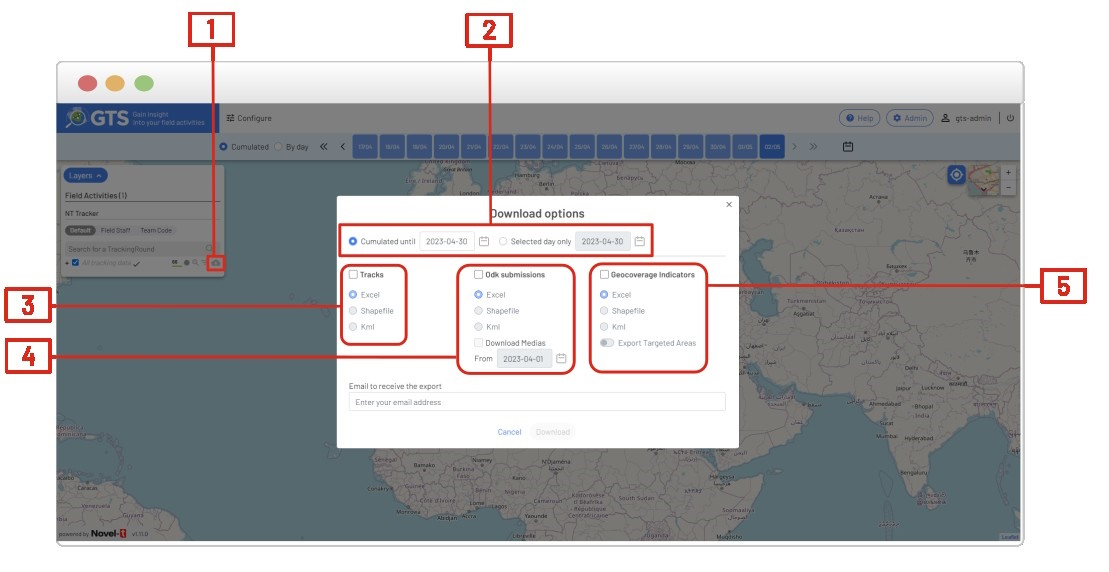
Data download form for tracks
The GTS will send an email to advise when the download has been prepared and is ready to be collected. The Download will include coordinates, time-stampe, user name, team code, device ID for the tracks as well as information concerning Aggregation Levels and Targeted Areas of the track’s location if this information has been configured for the Tracking Round.
When downloading and MS Excel file, the workbook will contain a work sheet for each Base Layer selected for aggregation in the administration console when configuring the targeted areas. Each base layer worksheet details the base layer details, aggregate base layer details, the number of targeted areas within the base layer and aggregates. If summation or average indicators were identified when configuring the targeted areas, the the calculations for these attributes will be included in the downloaded worksheet.
When configuring the Targeted Areas for the tracking round in the Administration console, there is and option to allow the downloading of targeted areas, if this has been selected the download option will include a toggle to download targeted areas information in a worksheetof the Excel download.
Warning
Depending on the number of targeted areas within scope of the tracking round, the size of the downloaded files may become very large impeding download. It may not be necessary to select ‘Export Targeted Areas’ as the aggregated targeted infromation details appear in the base layer worksheets.
Targeted Areas Details:
Click in the  icon to open the Targeted Areas details popup form
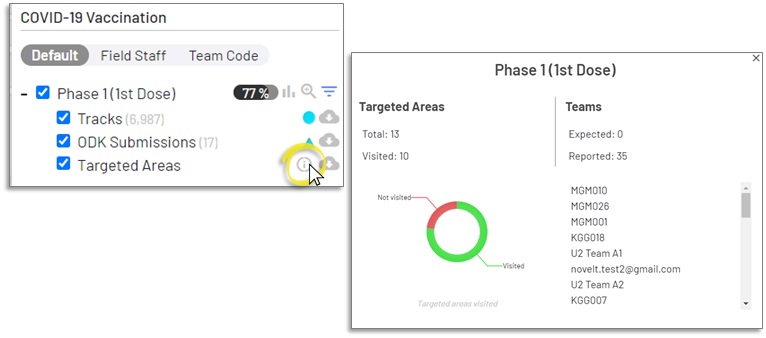
Targeted Areas details popup form
The Targeted Areas popup form displays the number of targeted areas visited versus the total number of targeted areas, it also details information about the Teams codes submitted for the tracks in the tracking round and compares them to the expected teams configured in the targeted areas administration console.
Number of Tracks:
The number of tracks and the number of ODK forms submitted is displayed in parenthesis next to the item in question.
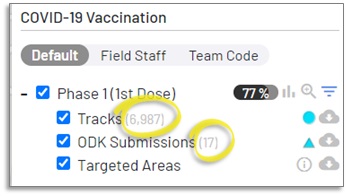
Count of tracks and ODK forms subbmitted witnin the tracking round
View/Hide Symbols:
Select/deselect the checkbox  to the left of the Tracks, ODK, or Targeted Areas titles to display or hide the associated map symbols, click on the tracking round checkbox to
show or hide all symbols for the tracking round.
to the left of the Tracks, ODK, or Targeted Areas titles to display or hide the associated map symbols, click on the tracking round checkbox to
show or hide all symbols for the tracking round.
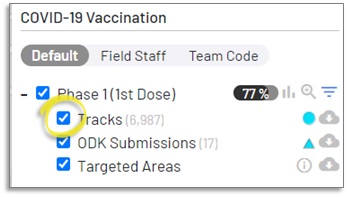
Select/deselect the checkbox to show or hide map symbols
Expand/Collapse Tracking Rounds:
Click on the ‘+’ / ‘-’ controls to the left of the tracking round name to expand or collapse the display of tracking round componenets.