Map & Geo-Coverage Investigation
Clicking on the View on Map button in the Configuration Settings, after selecting a Tracking Round, will open the map view. The GTS dashboard includes tools for geo-coverage analysis across different aggregation levels when Targeted Areas have been configured at the Tracking Round level.
Note
By default, the map will open in Geo-Coverage Investigation mode when Targeted Areas have been assigned.
Overview

GTS Map Overview
The map layout consists of three main components:
### 1. Header The header contains key elements for navigation and data interaction, arranged from left to right:
1 Current Tracking Round: Displays status, name, date, and associated Field Activity.
2 Date Picker: Allows filtering data by date.
3 Global Indicators: Provides key performance metrics for the selected Tracking Round.
4 Public Link Icon: Generates a shareable public link for the displayed data.
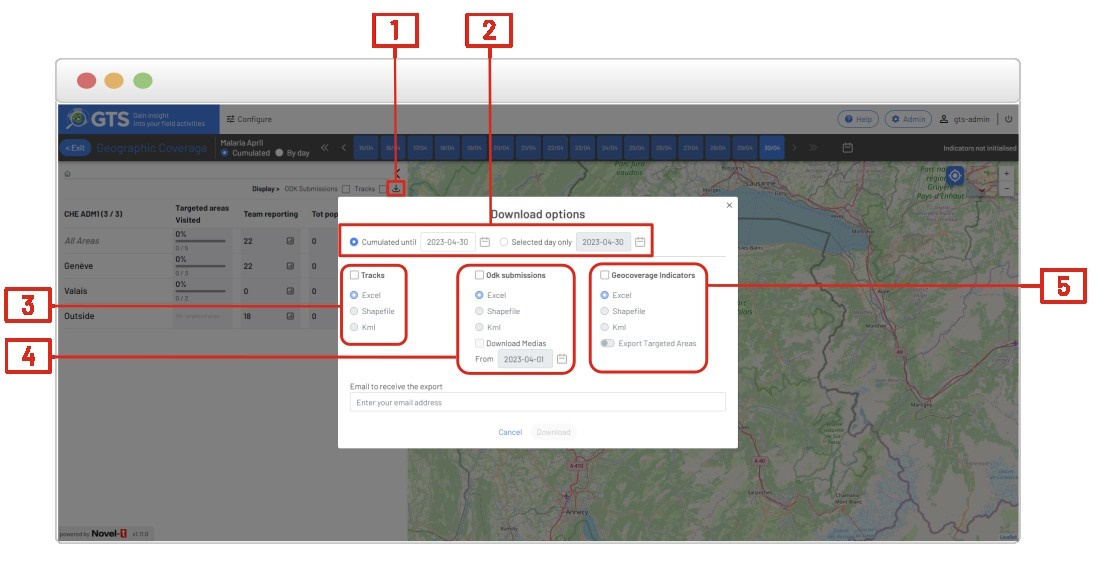
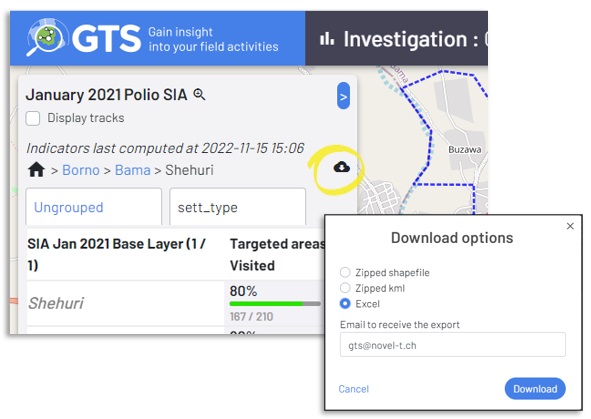
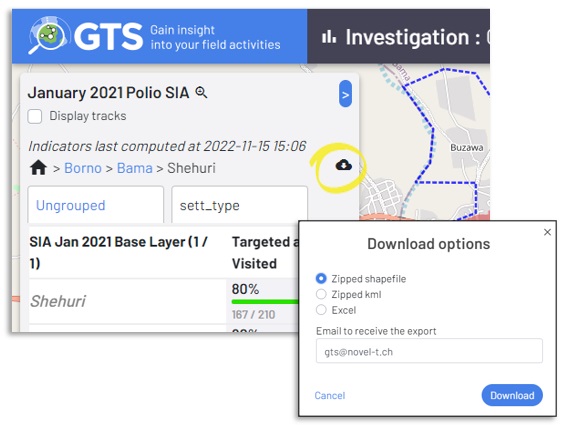
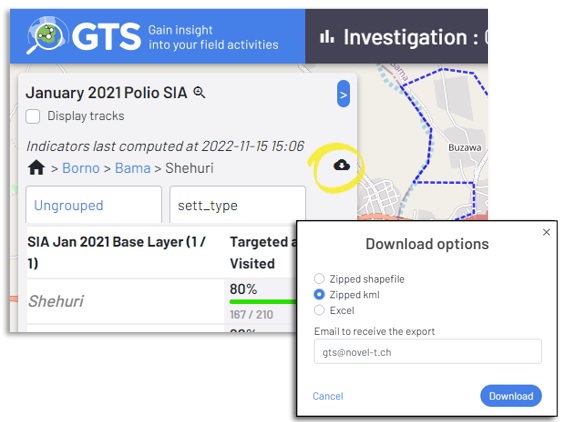
5 Export Icon: Enables downloading and exporting data from the Tracking Round.
6 User Profile Information: Displays details of the logged-in user.
7 Hamburger Menu: Provides access to additional settings and tools.
8 Indicator Calculation Status: Shows the current processing status of key indicators.
9 Search Icon: Allows quick searching within the dataset.
10 Investigation Sidebar & Map Controls Icons: Toggles visibility of the sidebar and additional map tools.

Aggregation Levels
The GTS Geo-Coverage Investigation mode features analysis at levels aggregation across nested base layers such as administrative boundaries to which targeted areas are attributed.
Selecting Base Layer Aggregation Level
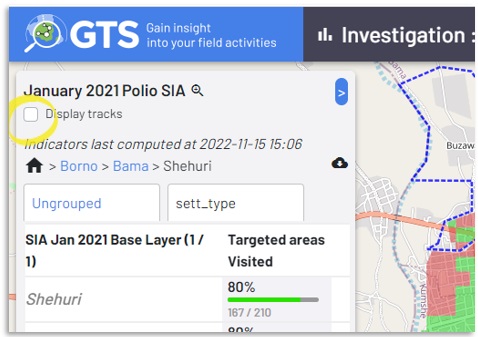
To investigate a base layer for deeper analysis, hover the mouse cursor over the base layer name. The name
will change colour to blue to indicate that it is a link and a magnifying glass icon  will appear to
the right of the name.
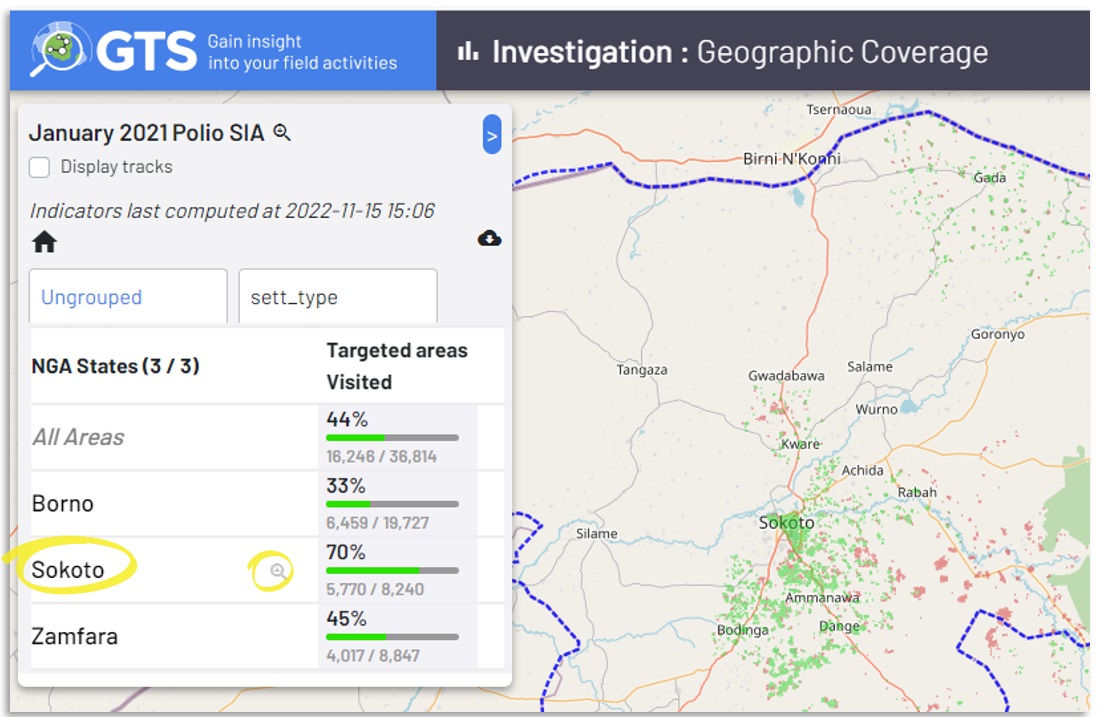
Highlighting a base layer
Click on the base layer name to drill down or click on the magnifying glass icon  to zoom the map to the
layer delineated the with a blue dashed line (click the magnifying glass icon again to remove the dashed line
delimitation).
Drill down into an Aggregation Level
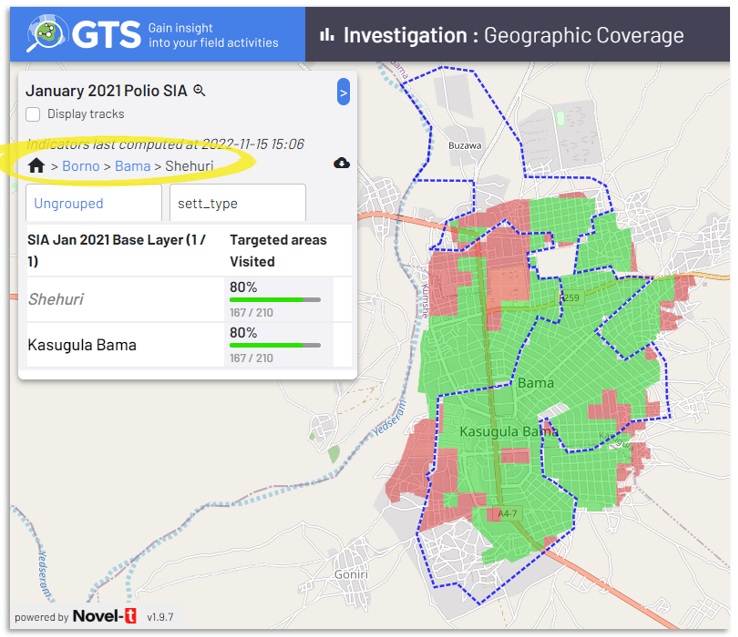
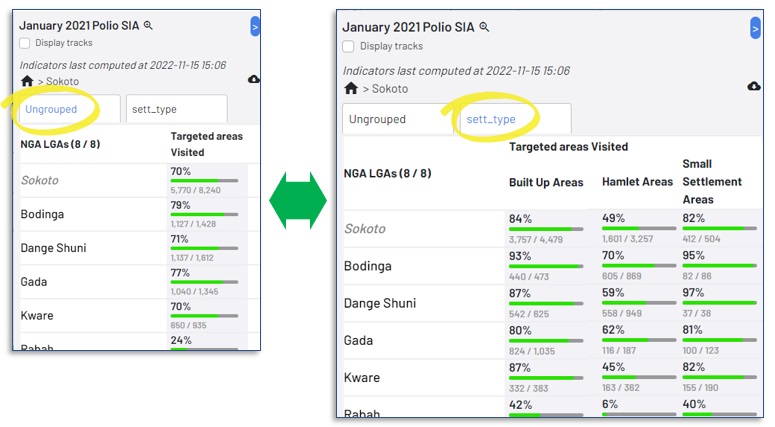
Clicking on base layer item names drill the analysis deeper to more details levels, with the lowest level being the Targeted Areas. To return to a higher level click on its name in the path (current level designated with a dashed blue underline higher levels appear in blue as clickable links)
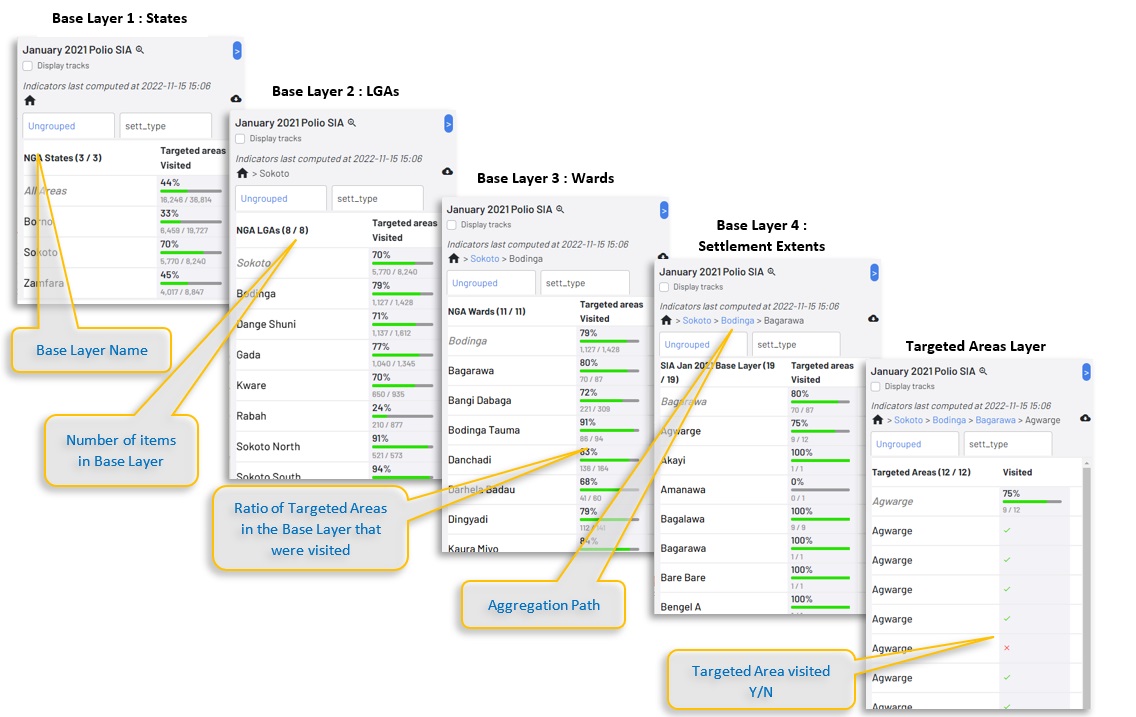
 control to return to the highest level at any time will performing analysis.
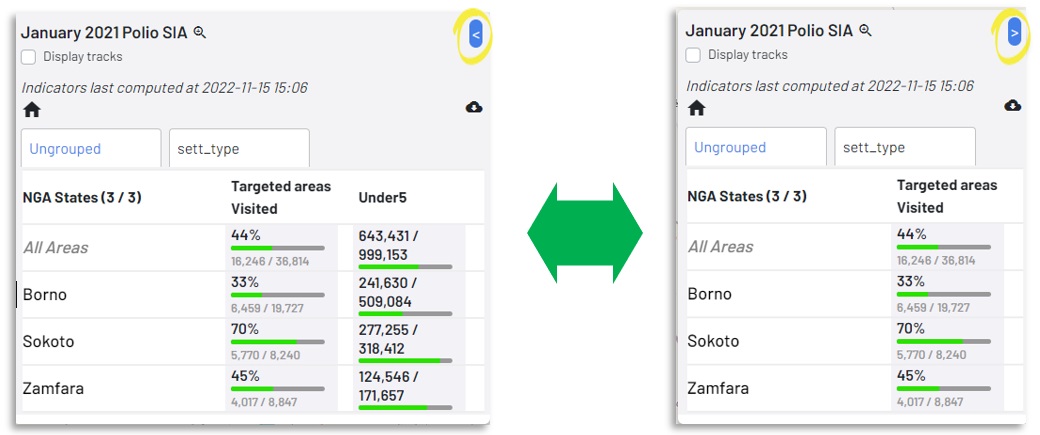
 control located in the upper right corner of the inset to horizontally collapse the inset to display only
Targeted Areas and hide quantatative attributes such as population rendering a greater portion of the map visible, click on the
same control to expand the inset to its original size.